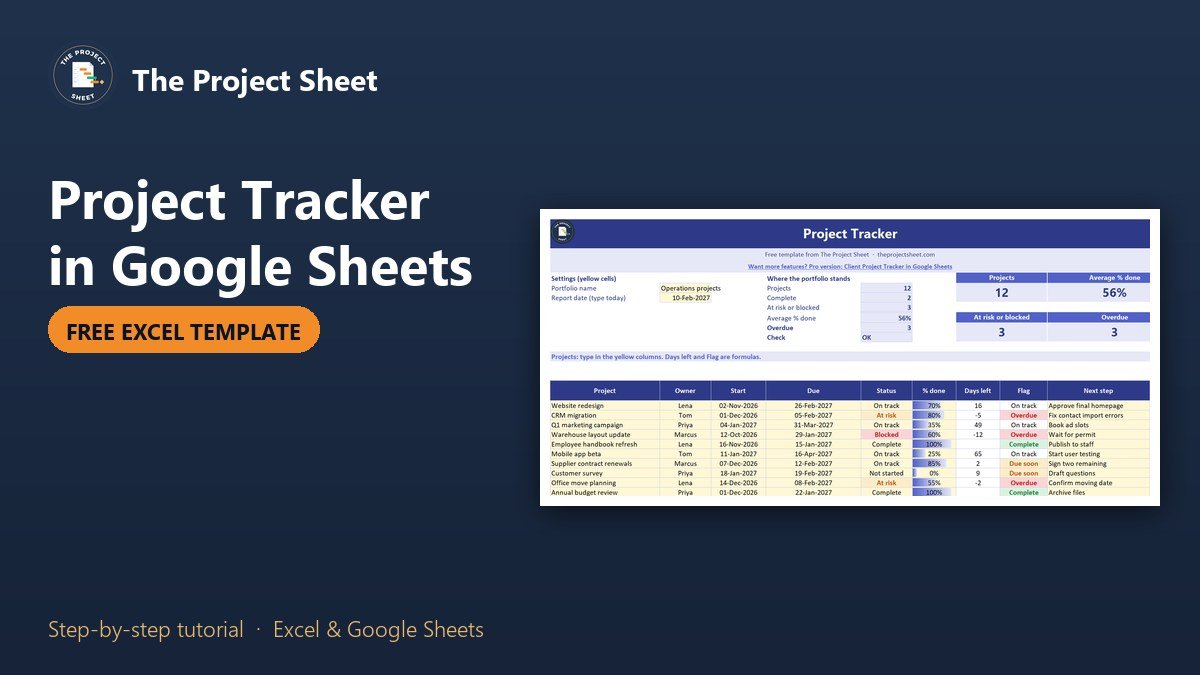
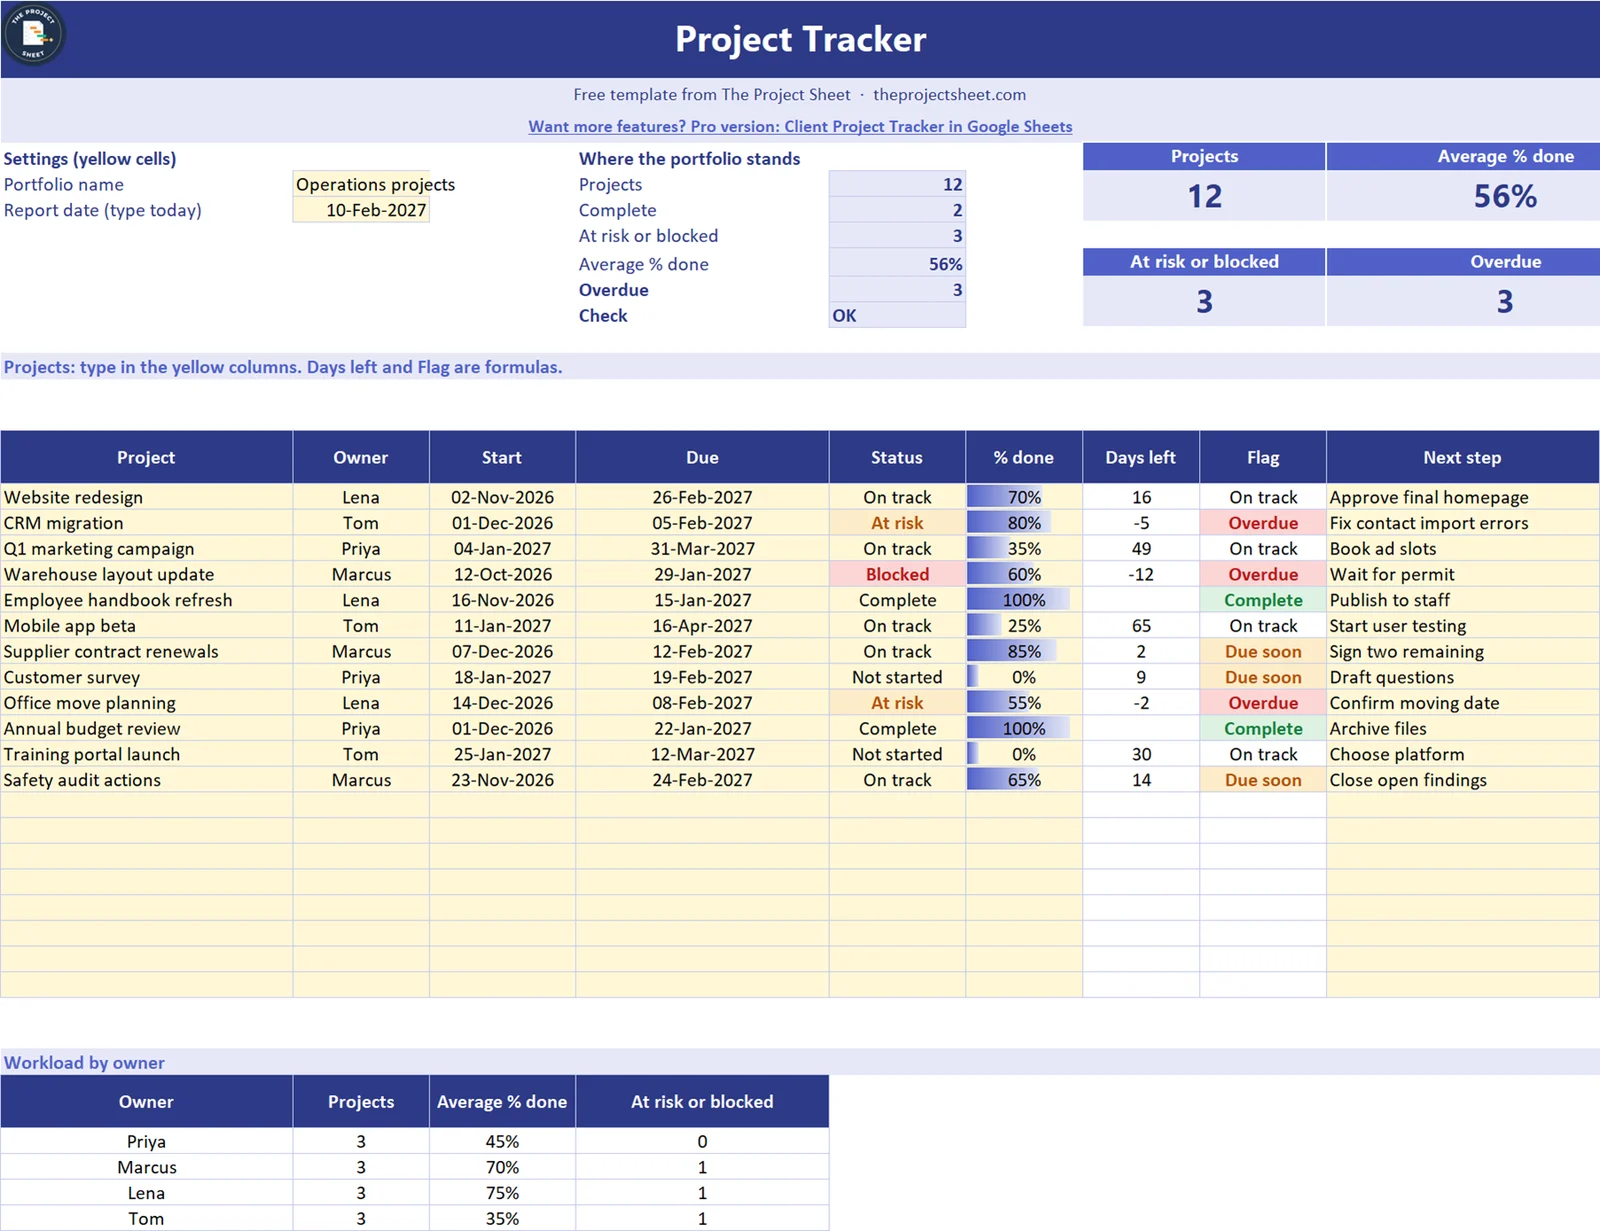
A project tracker is one table with a row for every project and the few columns you need to run them: who owns it, when it is due, its status and how far along it is. The free project tracker below works in Google Sheets and Excel. It calculates the days left, flags every project that is overdue or due soon, and summarizes the workload by owner. In the sample, 12 projects are 56% done on average, 3 are at risk or blocked and 3 are overdue.
Free download
Project Tracker (.xlsx, also opens in Google Sheets)
Working formulas, sample data and a How to use sheet. Opens in Excel, or import it into Google Sheets.
What a project tracker should show
A tracker is not a plan. A plan lists tasks and dependencies, like the Gantt chart in Google Sheets. A tracker answers a simpler question for the whole portfolio: which projects need my attention this week? That needs five things: an owner, a due date, a status, a percent done and a flag that does the date maths for you. Add a next step and each row tells you what happens now.
What is inside the free project tracker
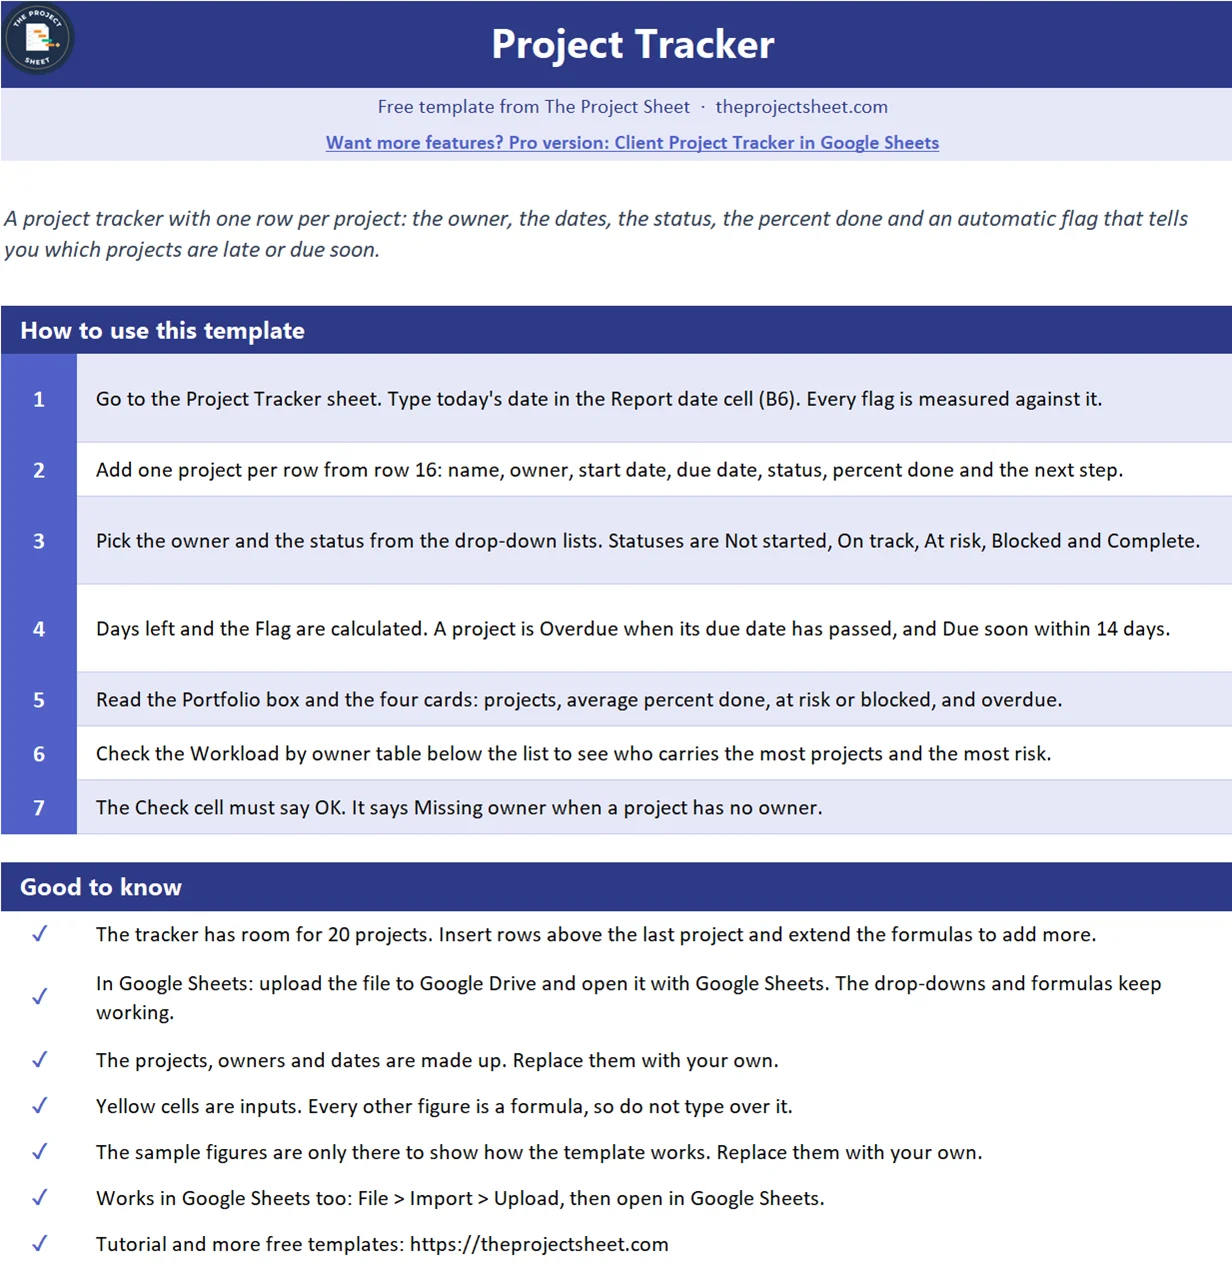
The workbook has a How to use sheet and one Project Tracker sheet. It has no macros, and it opens in Google Sheets: upload it to Google Drive and open it with Google Sheets. The Report date in B6 is the one cell you change each time you look at the tracker. The Portfolio box and four cards show the number of projects, the average percent done, projects at risk or blocked and overdue projects. The list has room for 20 projects, and a small Workload by owner table sits under it.
The sample is an operations portfolio with twelve made up projects, four owners and a report date of 10 February 2027. Replace it with your own.
Who this tracker is for
- Team leads who run several projects at once and need one page to review.
- Small business owners who track internal projects without a project management tool.
- Freelancers and agencies who want a client by client status list.
How to build the project tracker step by step
The list starts in row 16. Column A is the project, B the owner, C the start date, D the due date, E the status, F the percent done, G the days left, H the flag and I the next step. Columns A to F and I are typed. G and H are formulas.
Step 1: Drop-down lists for owner and status
Typing a status by hand leads to “On Track”, “on track” and “ontrack” in the same column, and every count after that is wrong. Use data validation instead. Select E16:E35, open Data, then Data validation, choose a list and type the five statuses: Not started, On track, At risk, Blocked and Complete. Do the same for the owner column with your team’s names. In Google Sheets the same menu is Data, then Data validation.
Step 2: Days left
Days left is the due date minus the report date, and it stays empty for finished projects. In G16:
=IF(OR(D16="",E16="Complete"),"",D16-$B$6)
The website redesign is due on 26 February 2027 and the report date is 10 February, so it shows 16. A negative number means the project is late: the CRM migration shows -5 and the warehouse layout update shows -12.
Step 3: The schedule flag
The flag turns the days left into a word. In H16:
=IF(A16="","",IF(E16="Complete","Complete",IF(D16<$B$6,"Overdue",IF(D16-$B$6<=14,"Due soon","On track"))))
Reading it from the inside out: a complete project is Complete, a project past its due date is Overdue, one due within 14 days is Due soon, and everything else is On track. Change the 14 if your team wants a longer warning. Conditional formatting adds red, amber and green so you can read the column at a glance.
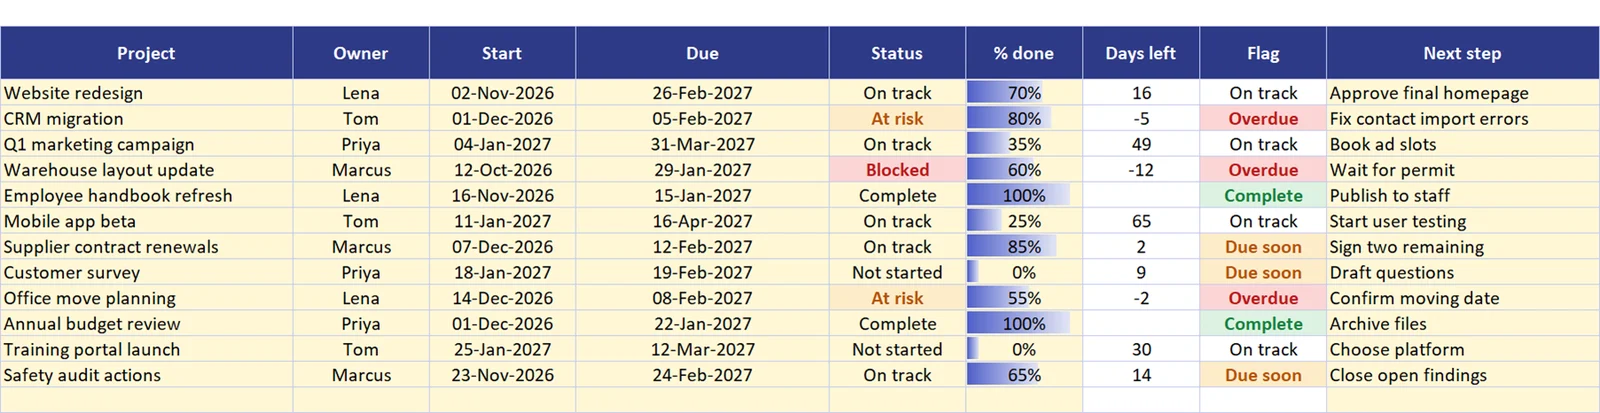
The status and the flag measure different things. Status is the owner’s opinion, and the flag is arithmetic. The CRM migration is marked At risk and is also Overdue by five days. The office move is At risk and overdue by two days. A project can be On track by status and still be Due soon by date, like the safety audit actions with 14 days left. When the two disagree, ask the owner why.
Step 4: Percent done with a data bar
Type the percent done as a number between 0 and 1, formatted as a percentage. A data bar in column F, from 0 to 100%, shows progress without any extra formula. Keep the number honest. A project that is 80% done by effort but waiting on a permit is not 80% done, so use the status to say it is blocked.
Step 5: The Portfolio box
The box counts the projects, the finished ones and the ones that need attention. At risk or blocked in E7:
=COUNTIF(E16:E35,"At risk")+COUNTIF(E16:E35,"Blocked")
The result is 3. Average percent done in E8 is:
=IF(E5=0,0,AVERAGE(F16:F35))
AVERAGE ignores empty cells, so the 8 unused rows do not pull the result down. The sample comes to 56%. Overdue in E9 counts the Overdue flags with =COUNTIF(H16:H35,"Overdue") and shows 3.
Step 6: Workload by owner
The table under the list counts projects and averages progress for each person. For the average in C40:
=IFERROR(AVERAGEIF($B$16:$B$35,A40,$F$16:$F$35),0)
The sample owners each have three projects. Lena averages 75% and Tom averages 35%, and Tom, Marcus and Lena each own one project that is at risk or blocked. If one name carries twice as many projects as the others, you have found a capacity problem before it shows up as a missed date.
Step 7: A check cell
A project nobody owns is a project nobody finishes. The check in E10 looks for it:
=IF(COUNTIFS(B16:B35,"",A16:A35,"<>")=0,"OK","Missing owner")
A weekly routine that takes ten minutes
Change the Report date to today. Read the cards first. Then sort or filter the Flag column and look at Overdue, then Due soon. For each one, ask the owner for the next step and type it in column I. Finish by looking at the Workload table. Share the sheet with your team in Google Sheets and everyone updates their own rows. If you want a simpler list of individual tasks, the task tracker in Google Sheets works the same way, and the project management template in Excel adds a dashboard.
Common mistakes
- Forgetting to update the report date. Every flag depends on it. If it is old, nothing looks late.
- Typing statuses freehand. Use the drop-down so the counts stay right.
- Marking everything On track. If nothing is ever At risk, the status is not telling you anything.
- Leaving the owner blank. Give every project one named person, not a team.
- Keeping finished projects forever. Move them to an archive sheet once a quarter.
Adapt the tracker to your own projects
Replace the sample rows with your projects, edit the owner list and set the report date. Add a column for budget or priority if you need one, and copy the flag logic. To track more than 20 projects, insert rows above the last project and fill the formulas down.
Want more than the free file?
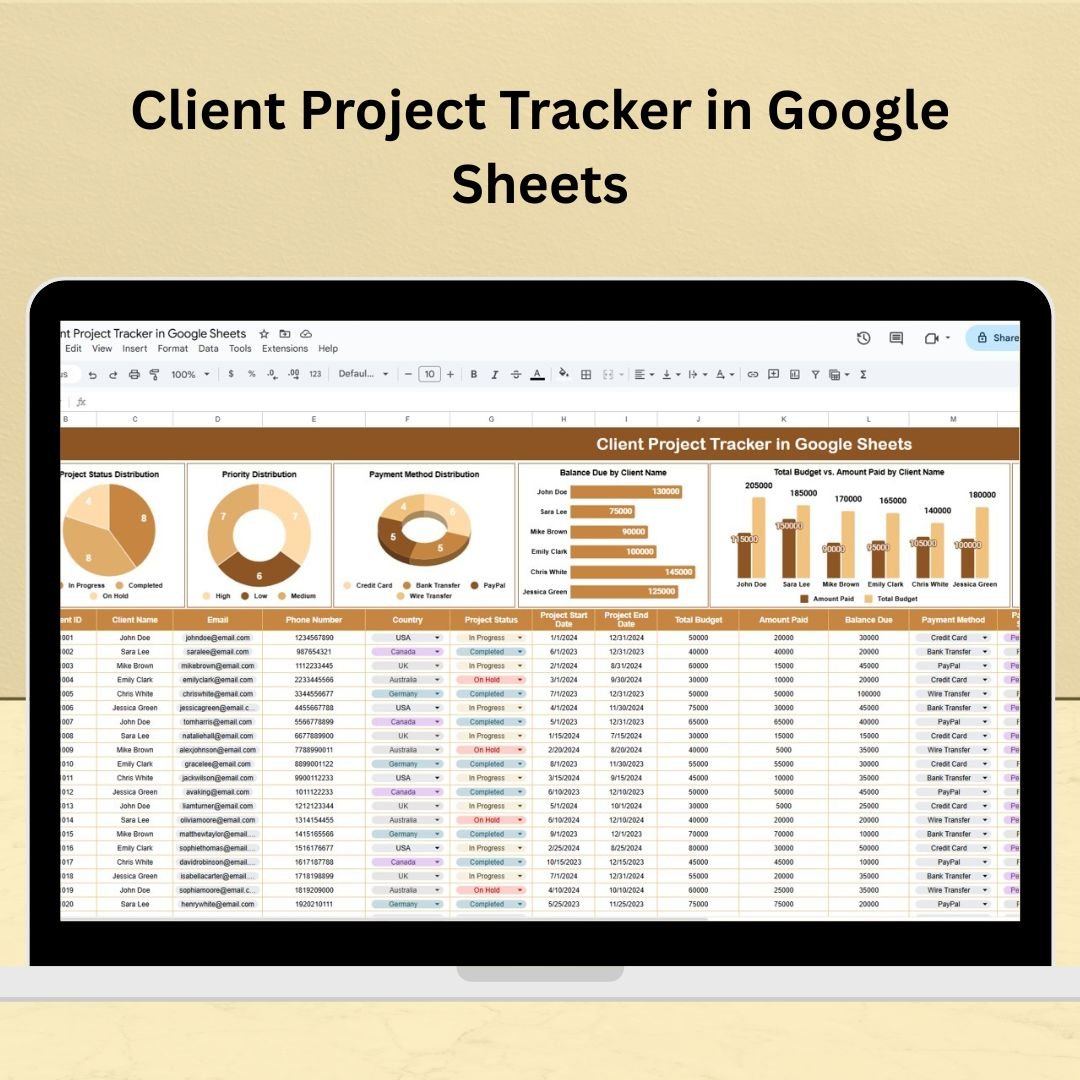
Client Project Tracker in Google Sheets
A client project dashboard in Google Sheets with project status, budget, deadlines and progress by client in one place.
Your next step: download the file, type today’s date in the Report date cell and list your five most important projects with an owner and a due date.
Frequently asked questions
How do I make a project tracker in Google Sheets?
List one project per row with an owner, a due date, a status and a percent done. Add a days left column with =D16-$B$6 and a flag formula that returns Overdue, Due soon or On track. Use data validation for the status column.
What columns should a project tracker have?
At minimum: project name, owner, start date, due date, status, percent done and a next step. Add days left and a flag so the sheet tells you which projects are late without you checking each date.
How do I flag overdue projects automatically?
Compare the due date with a report date cell. A formula such as =IF(E16="Complete","Complete",IF(D16<$B$6,"Overdue","On track")) does it. Then add conditional formatting to color the flag.
What is the difference between a project tracker and a project plan?
A plan breaks one project into tasks with dates and dependencies. A tracker lists many projects on one page with their owner, status and progress, so you can see which ones need attention.
Does this project tracker work in Google Sheets?
Yes. Upload the file to Google Drive and open it with Google Sheets. The drop-down lists, COUNTIF, AVERAGEIF and the conditional formatting all work there.
Free download
Project Tracker (.xlsx, also opens in Google Sheets)
Working formulas, sample data and a How to use sheet. Opens in Excel, or import it into Google Sheets.
Want the finished version?
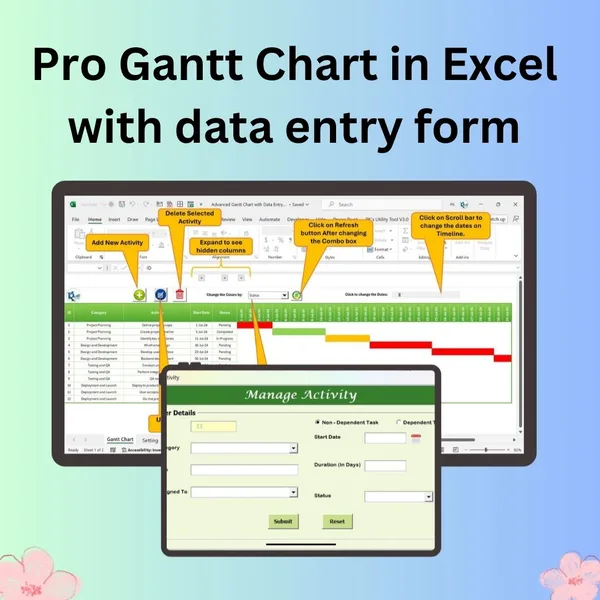
Pro Gantt Chart in Excel with Data Entry Form
Add and update activities through a form while the Gantt chart updates itself.
View the pro template
PK is the founder of PK: An Excel Expert and NextGenTemplates.com and a corporate trainer in Excel, VBA and Power BI. Since 2020 he and his team have built Excel and Google Sheets tutorials and templates for business users, including many project management tools.