
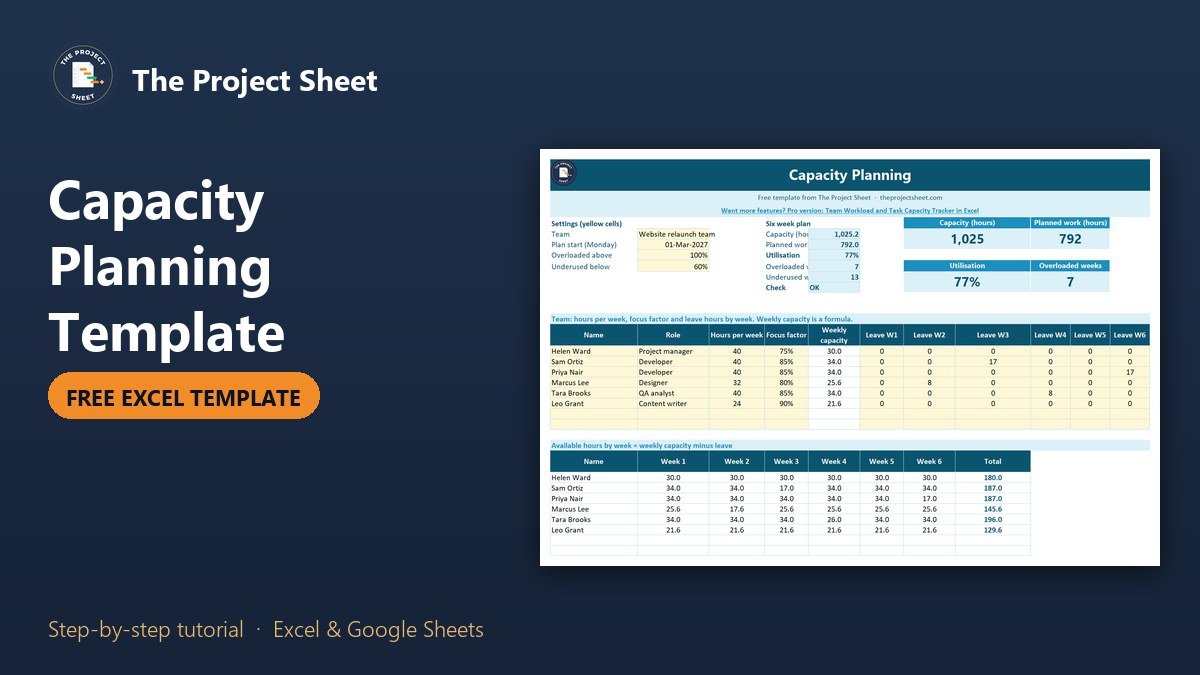
A capacity planning template compares the hours each person has free with the hours of work planned for them, week by week, so you can see who is overloaded before it happens. The free capacity planning template in Excel below takes contracted hours, a focus factor and leave, adds up the planned work from a task list with SUMIFS and colors a utilisation heat map. In the sample, a six person team has 1,025.2 hours of capacity over six weeks against 792 hours of planned work, 77% overall, yet 7 person weeks are over 100%.
Free download
Capacity Planning Template (.xlsx, also opens in Google Sheets)
Working formulas, sample data and a How to use sheet. Opens in Excel, or import it into Google Sheets.
What capacity planning answers
A project plan tells you what has to happen and when. Capacity planning asks whether the people can actually do it. A team can look fine in total and still have one developer booked for two weeks of work in a week when they are on leave half the time. The only way to see that is to compare planned hours with available hours per person and per week.
Available hours are not the same as contracted hours. Meetings, email and support take part of every week, so good capacity plans apply a focus factor, often 70% to 85%, and then take leave off on top.
What is inside the free capacity planning template
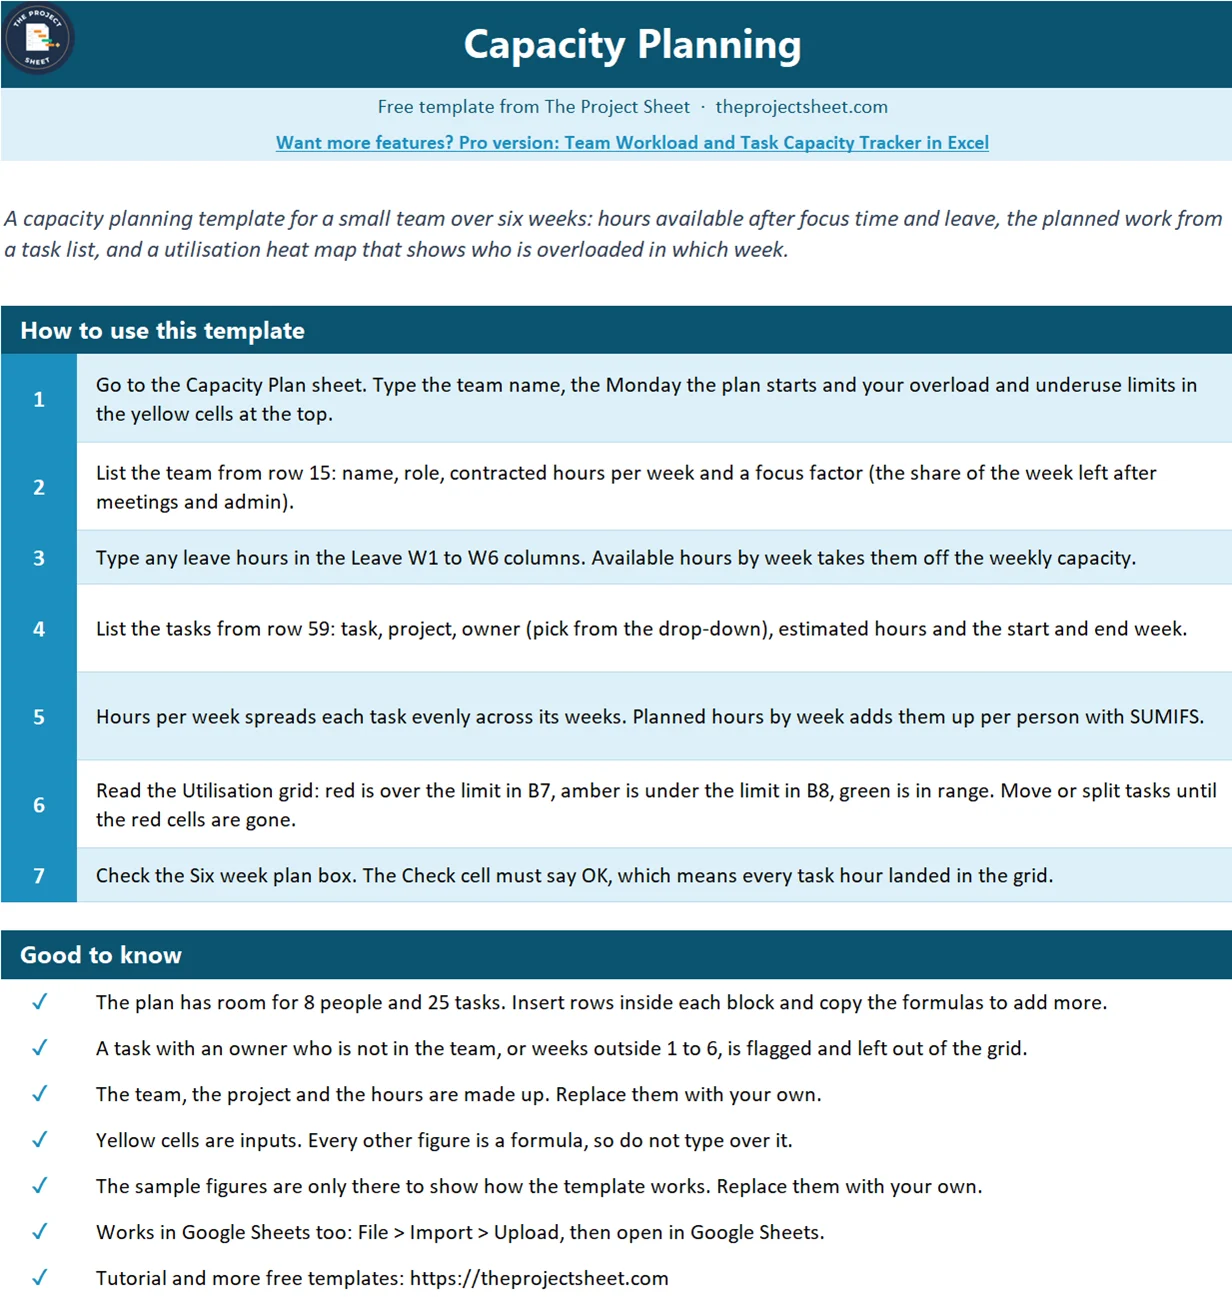
The workbook has a How to use sheet and one Capacity Plan sheet. It has no macros and opens in Google Sheets. Four yellow cells at the top hold the team name, the Monday the plan starts and the limits for overloaded and underused weeks. A Six week plan box and four cards show the capacity, the planned work, the utilisation and the number of overloaded weeks.
Below that are five blocks: the team with hours, focus factor and leave, the available hours by week, the planned hours by week, the utilisation heat map and the task list. The sample is a made up website relaunch with a project manager, two developers, a designer, a QA analyst and a content writer, and 17 tasks over six weeks from 1 March 2027.

Who this template is for
- Project managers who need to check a plan before they commit to dates.
- Team leads who share people across a project and day to day support work.
- Small agencies and studios planning several weeks of client work for a few people.
How to build the capacity plan step by step
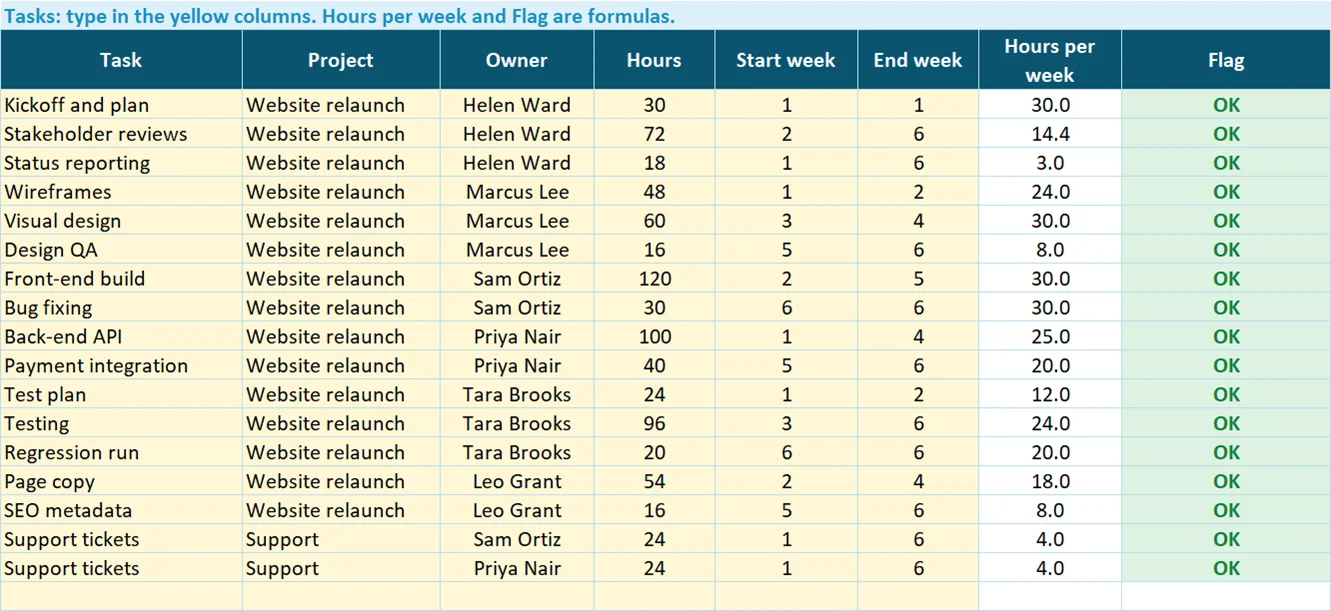
The team is in rows 15 to 22: name in A, role in B, hours per week in C, focus factor in D and leave hours for weeks 1 to 6 in F to K. The tasks are in rows 59 to 83: task, project, owner, hours, start week and end week. The overload limit is in B7 and the underuse limit in B8.
Step 1: Weekly capacity with a focus factor
In E15, multiply the contracted hours by the focus factor:
=IF(A15="","",C15*D15)
Helen, the project manager, works 40 hours at a 75% focus factor, so she has 30.0 hours a week for project work. The developers are at 85%, so 34.0 hours each. Marcus, the designer, works 32 hours a week at 80%, which leaves 25.6.
Step 2: Available hours by week
The first grid takes leave off the weekly capacity. In B26:
=IF($A15="","",$E15-F15)
Copy it across six columns and down eight rows. Sam is off for half of week 3, so his available hours drop from 34.0 to 17.0 that week. Priya has the same in week 6. The grid total in E5 is the team capacity for the whole plan, 1,025.2 hours.
Step 3: Spread each task across its weeks
Each task has a start week and an end week. In G59, divide the hours by the number of weeks so the work spreads evenly:
=IF(A59="","",IF(F59<E59,0,D59/(F59-E59+1)))
The front-end build is 120 hours from week 2 to week 5, so it puts 30.0 hours into each of those four weeks. If your tasks are uneven, split a long task into two rows with different hours.
Step 4: Planned hours by week with SUMIFS
This is the formula that does the work. The week numbers 1 to 6 sit in the header row of the grid, formatted to read Week 1, Week 2 and so on, so the formula can compare them. In B37:
=IF($A15="","",SUMIFS($G$59:$G$83,$C$59:$C$83,$A37,$E$59:$E$83,"<="&B$36,$F$59:$F$83,">="&B$36))
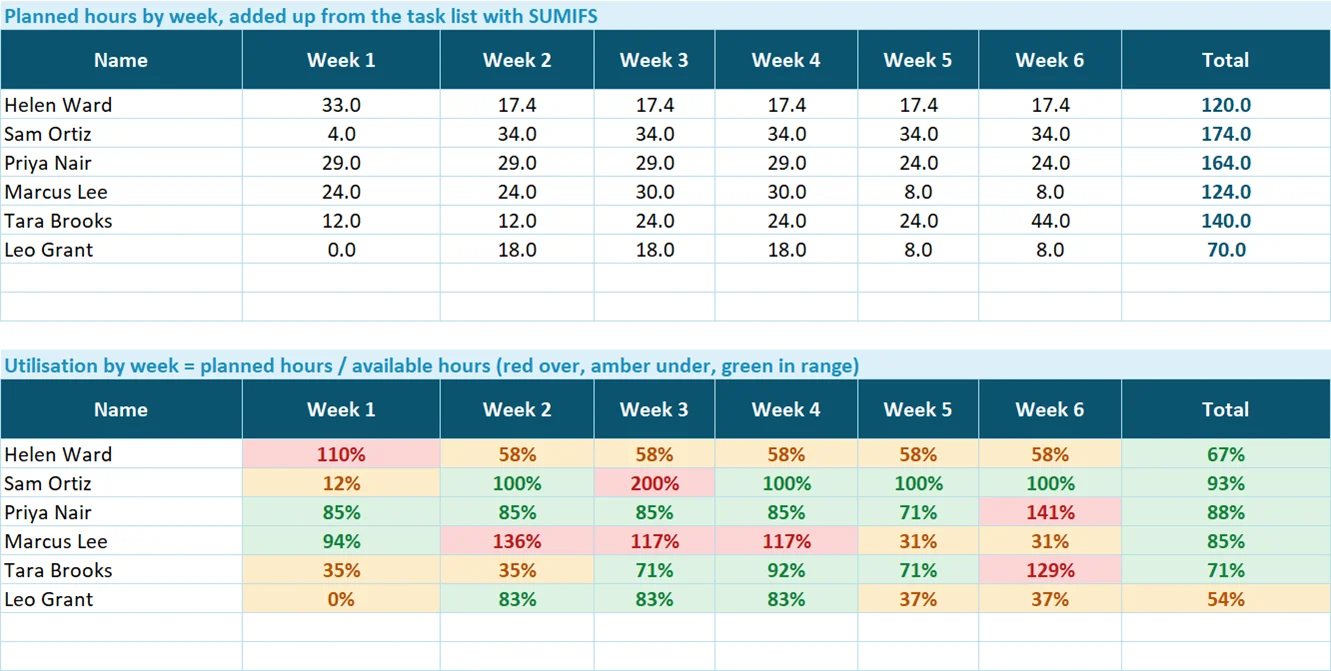
SUMIFS adds the hours per week of every task where the owner is this person, the task starts on or before this week and ends on or after it. The dollar signs keep the task ranges fixed while the person and the week change as you copy. Sam has the front-end build plus 4 hours of support tickets, so weeks 2 to 5 show 34.0 planned hours.
Step 5: Utilisation and the heat map
Utilisation is planned hours divided by available hours. In B48:
=IF($A15="","",IF(B26<=0,0,B37/B26))
Three conditional formatting rules color the grid: red when a cell is over B7, amber when it is under B8 and green otherwise. Sam’s week 3 is the problem the totals hide. He has 34.0 hours of work and only 17.0 available, so he is at 200%. Marcus is at 136% in week 2 because of a day of leave in the middle of the wireframes, and Tara is at 129% in week 6 when testing and the regression run land together. Leo, on the other hand, is at 37% in weeks 5 and 6.
The fix is to move work, not to ask people to work late. Sam has 30 free hours in week 1, so starting part of the front-end build a week earlier takes most of the pressure off week 3, and Priya, the other developer, has a few spare hours that week too. Tara is at 35% in weeks 1 and 2, so writing the regression scripts then clears her week 6. Change the start weeks in the task list and the grid recolors at once.
Step 6: Summary box and check
The box at the top counts the red and amber cells with COUNTIF against the limits:
=COUNTIF(B48:G55,">"&B7)
The check cell compares the planned hours in the grid with the hours in the task list:
=IF(ROUND(E6-SUM($D$59:$D$83),1)=0,"OK","Hours not in the grid")
If an owner is misspelled or a task runs outside weeks 1 to 6, its hours never reach the grid and the check says so. The task Flag column shows which row is the cause.
Where capacity planning fits
Capacity planning sits between the schedule and the people. Build the dates first in a project schedule template, then check them here. Once the work starts, compare the plan with real hours from a timesheet template in Excel and update the focus factor if people spend more time on meetings than you thought. To keep tasks, status and this capacity view together, use the project management template in Excel.
Common mistakes
- Planning at 100% of contracted hours. Nobody spends a full week on project work. Use a focus factor.
- Checking only the team total. A team at 77% can still have a person at 200% in one week. Read the grid, not just the cards.
- Forgetting leave and holidays. Type them in before you set dates, not after someone is already overloaded.
- Leaving out support and day to day work. Add it as its own task so the time is counted.
- Owner names that do not match. Pick the owner from the drop-down so SUMIFS finds every task.
Want more than the free file?
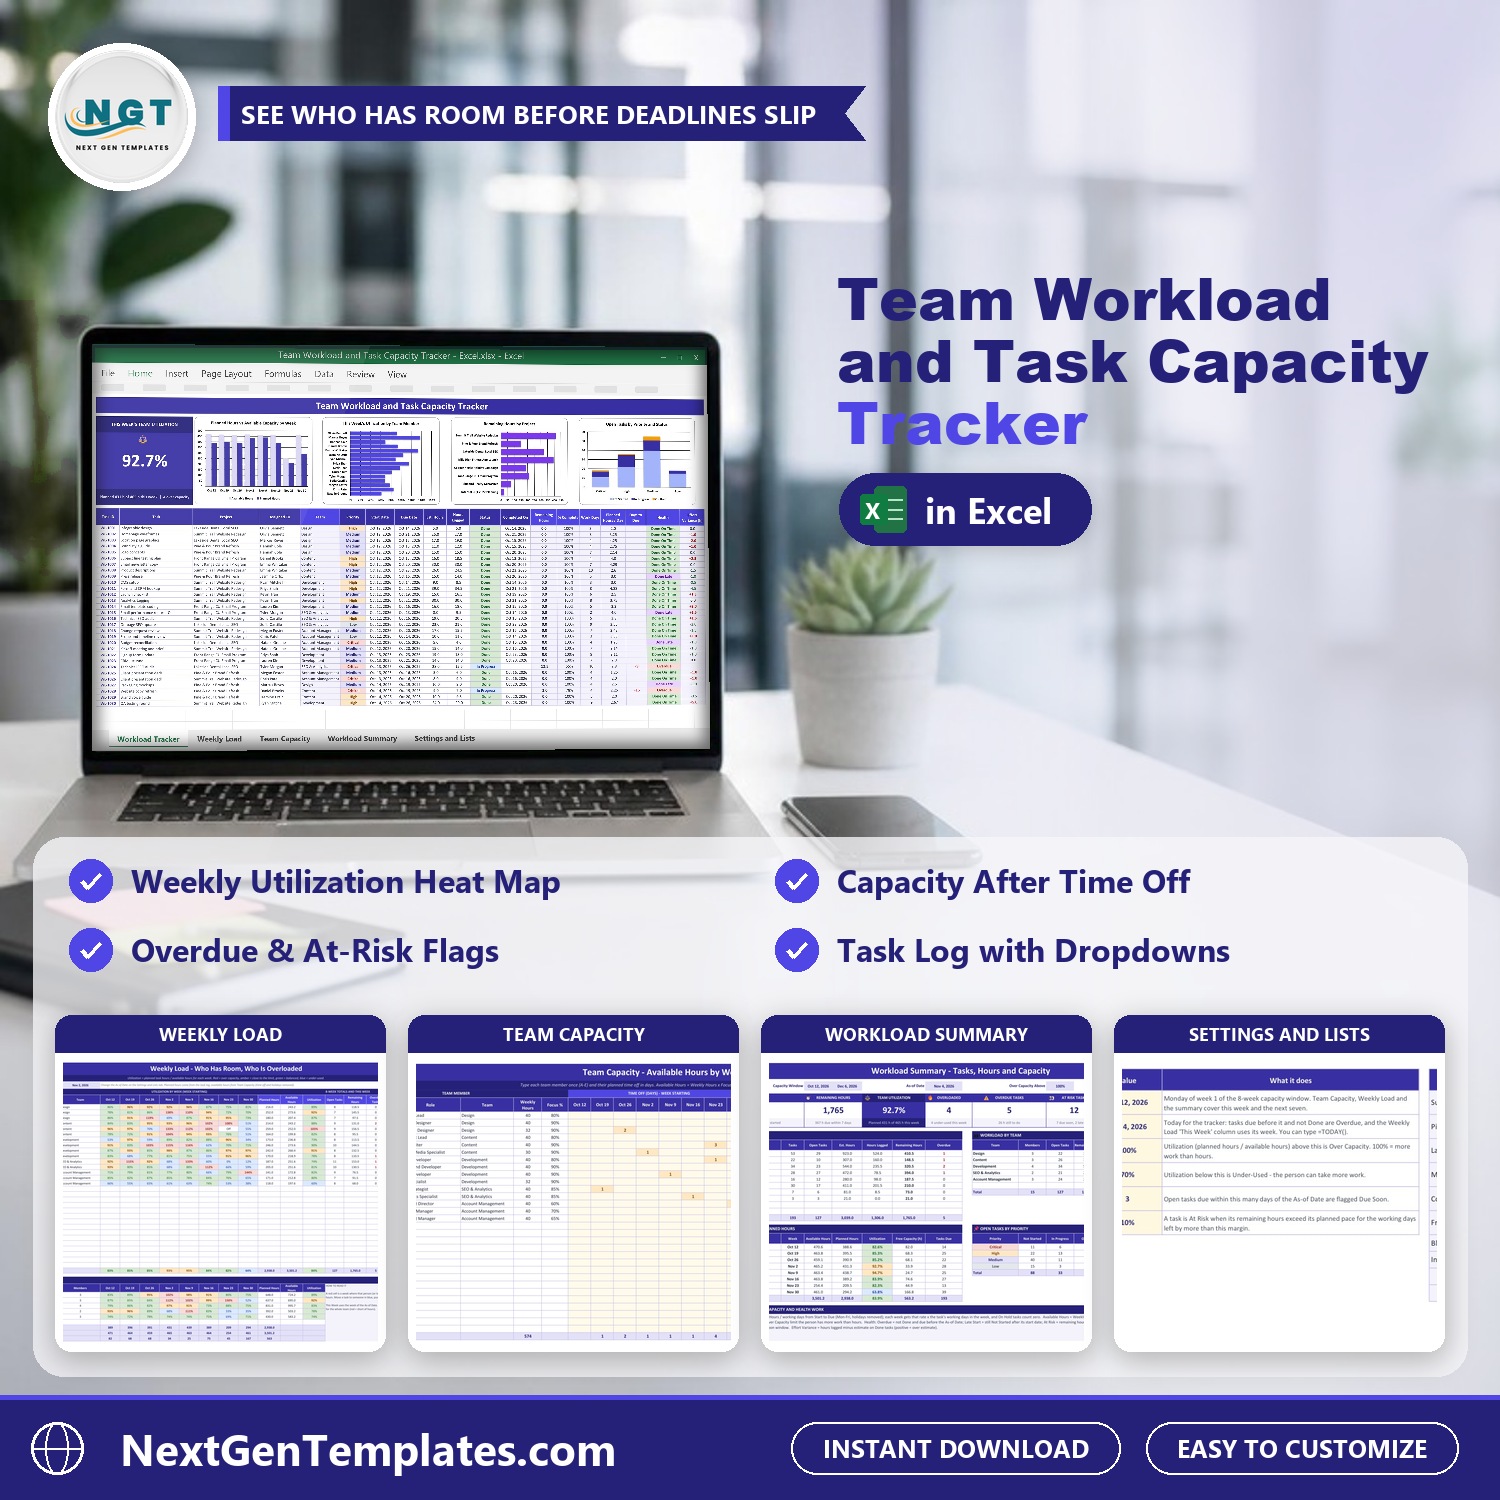
Team Workload and Task Capacity Tracker in Excel
Track every task, owner and hour against team capacity in Excel, with workload by person, overload alerts and a dashboard of who has room for more.
Frequently asked questions
What is a capacity planning template?
It is a sheet that compares the hours each team member has available with the hours of work planned for them, usually week by week, so you can spot overloaded and underused people before the work starts.
How do I calculate team capacity in Excel?
Multiply each person's contracted hours by a focus factor, for example =C15*D15 for 40 hours at 85%, then subtract leave for each week. Add the grid up with SUM for the team total.
How do I add up planned hours per person per week in Excel?
Use SUMIFS on the task list with three conditions: the owner equals the person, the start week is on or before the week and the end week is on or after it.
What is a good utilisation rate?
Many teams aim for about 70% to 90% of available hours. Over 100% means overtime or slipping dates. Very low utilisation means people could take on more work.
Does this capacity planning template work in Google Sheets?
Yes. Upload the file to Google Drive and open it with Google Sheets. SUMIFS, COUNTIF, the drop-down list and the conditional formatting all work there.
Free download
Capacity Planning Template (.xlsx, also opens in Google Sheets)
Working formulas, sample data and a How to use sheet. Opens in Excel, or import it into Google Sheets.
Want the finished version?
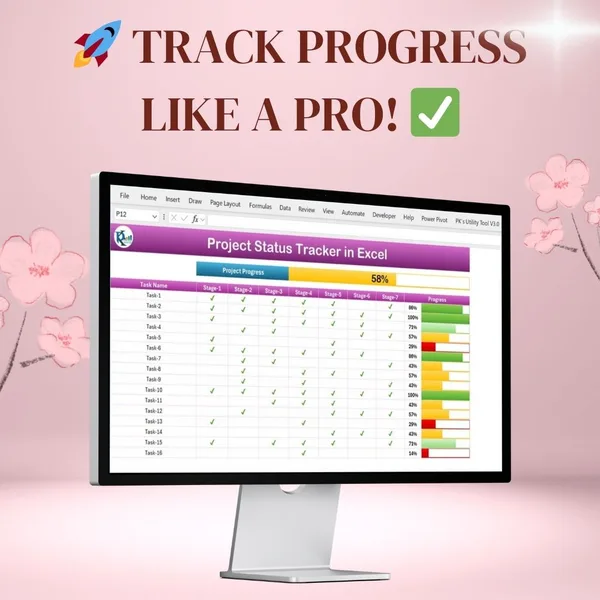
Project Progress Tracker in Excel
Colour-coded progress bars and automatic completion percentages.
View the pro template
PK is the founder of PK: An Excel Expert and NextGenTemplates.com and a corporate trainer in Excel, VBA and Power BI. Since 2020 he and his team have built Excel and Google Sheets tutorials and templates for business users, including many project management tools.