

A project management template in Excel is a single workbook that lists every task with an owner, a due date and a status, then flags what is late or at risk. You build it by setting up a task table, adding dropdowns for priority and status, and writing a formula that turns dates and status into a flag. The free template is below, already built, so you can use it as is or follow the steps to make your own.
Free download
Project Tracker Template (Excel)
Working formulas, sample data and a How to use sheet. Opens in Excel, or import it into Google Sheets.
What this project tracker does and who it is for
This project tracker Excel file has two sheets: ‘How to use’ and ‘Tracker’. The Tracker sheet holds up to 50 tasks (rows 9 to 58), and a summary block beside the table counts tasks by status and shows overall progress.
It suits project managers who need a quick view of a small project, team leads who run weekly status meetings, PMP learners practicing task tracking, and freelancers who want one page to share with a client. If you need a task tracker Excel file with clear flags and no setup, this is the right size.
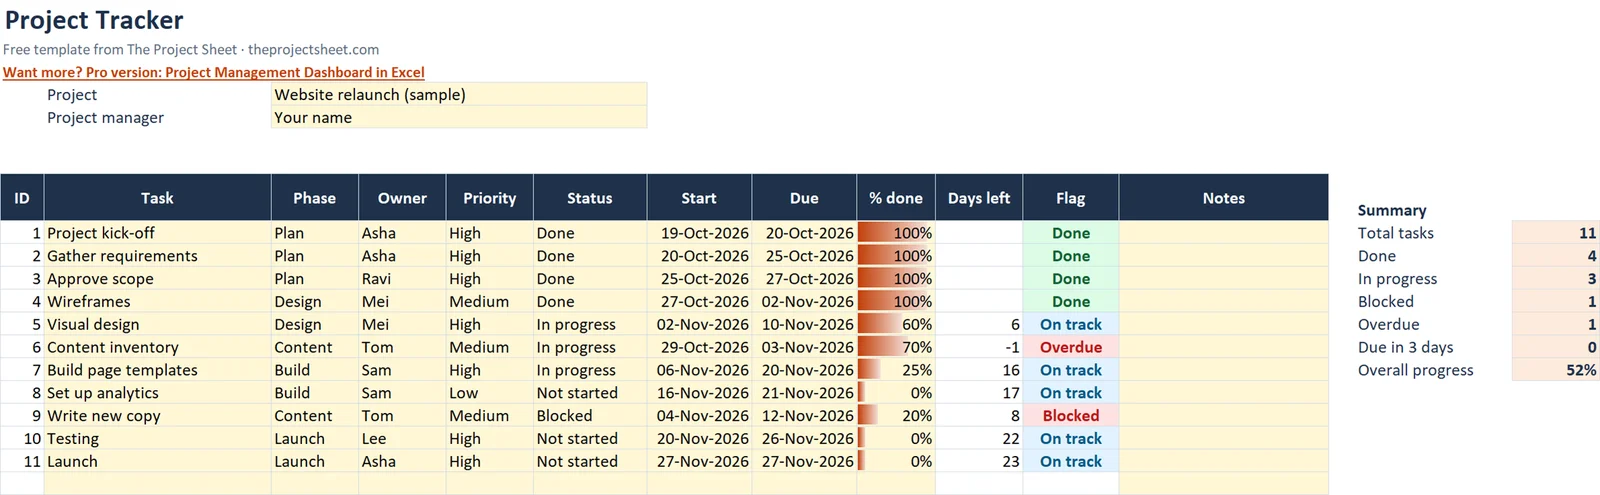
The sample project is a website relaunch with 11 tasks across five phases: Plan, Design, Content, Build and Launch. In the sample, ‘Content inventory’ is overdue and ‘Write new copy’ is blocked, so you can see the flags working straight away.
What each column does
Most columns are plain inputs. Three of them (ID, Days left and Flag) are formulas, so you should leave those alone and type only into the others.
| Column | Field | How it works |
|---|---|---|
| A | ID | Formula, numbers rows automatically |
| B | Task | You type it |
| C | Phase | You type it |
| D | Owner | You type it |
| E | Priority | Dropdown: High, Medium, Low |
| F | Status | Dropdown: Not started, In progress, Blocked, Done |
| G | Start | Date you enter |
| H | Due | Date you enter |
| I | % done | You type it, shown with a data bar |
| J | Days left | Formula |
| K | Flag | Formula with color coding |
| L | Notes | You type it |
Why the flag matters more than the status column
A status you type by hand only tells you what the task owner believes. A flag is calculated from the due date and today’s date, so it catches a task that someone forgot to update. A task marked In progress with a due date last week still turns red.
That is the main reason to use a project tracking template with a formula instead of a plain list. You scan one column, look for red and amber, and know where to spend your time.
How to build the project tracking template step by step
Step 1: Set up the project details
On a sheet named Tracker, put the project name in C4 and the project manager in C5. Add labels in column B next to them so anyone opening the file knows what they are looking at.
Step 2: Create the header row
In row 8, enter these headers from A to L: ID, Task, Phase, Owner, Priority, Status, Start, Due, % done, Days left, Flag, Notes. Your task rows run from row 9 to row 58, which gives you room for 50 tasks.
Step 3: Number the tasks automatically
In A9, enter this formula and fill it down to row 58:
=IF(B9="","",ROW()-8)
The ID stays blank until you type a task name in column B, so empty rows look clean. Row 9 gives ID 1, row 10 gives ID 2, and so on.
Step 4: Add the dropdowns
Select E9:E58 and use Data Validation with a list: High, Medium, Low. Then select F9:F58 and add a list with Not started, In progress, Blocked, Done. Dropdowns keep spelling consistent, which matters because the formulas compare the text exactly.
Step 5: Show progress with a data bar
Enter the percentage complete for each task in column I. Apply a data bar through Conditional Formatting to I9:I58 so progress is visible at a glance.
Step 6: Calculate days left
In J9, enter:
=IF(OR(B9="",H9="",F9="Done"),"",H9-TODAY())
This returns the number of days until the due date. It stays blank when the task is empty, has no due date, or is done. A negative number means the due date has already passed.
Step 7: Build the status flag
In K9, enter:
=IF(B9="","",IF(F9="Done","Done",IF(H9="","",IF(H9<TODAY(),"Overdue",IF(H9-TODAY()<=3,"Due soon",IF(F9="Blocked","Blocked","On track"))))))
The order matters. Excel stops at the first test that is true, so the checks run in a fixed sequence, shown below.
| Check order | Test | Flag shown |
|---|---|---|
| 1 | Task name in B is empty | Blank |
| 2 | Status is Done | Done |
| 3 | Due date is empty | Blank |
| 4 | Due date is before today | Overdue |
| 5 | Due date is within 3 days | Due soon |
| 6 | Status is Blocked | Blocked |
| 7 | Anything else | On track |
Step 8: Color code the flags
Add conditional formatting rules to K9:K58 based on the cell text. Use red for Overdue and Blocked, amber for Due soon, green for Done and blue for On track.
Step 9: Build the summary block
In N8:O15, list the measures you want and put these formulas beside them:
- Total tasks:
=COUNTA(B9:B58) - Done:
=COUNTIF(F9:F58,"Done") - In progress, using the same COUNTIF pattern on column F
- Blocked, using the same COUNTIF pattern on column F
- Overdue:
=COUNTIF(K9:K58,"Overdue") - Due in 3 days, counting the Due soon flags in column K
- Overall progress:
=IFERROR(SUM(I9:I58)/COUNTA(B9:B58),0)
The IFERROR wrapper returns 0 when the sheet is empty, so you do not see a divide-by-zero error before you add your first task.
Step 10: Freeze the panes
Select C9 and choose Freeze Panes. The header row and the ID and task columns then stay visible while you scroll through a long list.
Worked example with the sample figures
The sample website relaunch has 11 tasks, so Total tasks shows 11. Four are Done, three are In progress and one is Blocked. The other three tasks have not started.
The Overdue count is 1, which is ‘Content inventory’. ‘Write new copy’ is Blocked, which is one of the two flags shown in red. Overall progress is 52%, the sum of the % done column divided by the 11 tasks.
Notice that dates are checked before status. A task that is both past due and blocked shows Overdue, not Blocked, because the due date check comes earlier in the formula. If you want blocked tasks to take priority, move the Blocked check above the date checks.
Try changing one value to see the logic. Set the status of ‘Content inventory’ to Done and its flag turns green, the Overdue count drops to 0 and the Done count goes up by one. That quick test is a good way to confirm your own copy of the sheet is wired correctly.
Using the tracker in a weekly status meeting
The sheet works best when it is updated right before the meeting, not during it. A simple routine keeps the meeting short.
- Ask each owner to update the Status and % done for their rows.
- Check the summary block first: Overdue, Blocked and Due in 3 days.
- Filter column K to look at red flags, then discuss what is needed to clear each one.
- Filter column D by owner so each person sees only their own tasks.
- Add the decisions to the Notes column in L, then clear the filter.
Because the summary counts update on their own, you can paste those figures into a status email without extra work.
How to adapt it
- Rename the phases in column C to match your own project, such as discovery, build and handover.
- Change the 3-day warning by editing the number in the Due soon part of the formula in column K and in the summary count.
- Add more status values to the dropdown only if you also update the formulas that depend on them.
- Before a status meeting, filter column D by owner so each person sees only their tasks.
- Sort by the Due column to see the next deadlines at the top, then clear the sort when you are done.
- If you need dates on a timeline, the Gantt chart in Excel guide shows how to build one from start and due dates like these.
- To clarify who does what, pair the tracker with a RACI chart template.
Tracking risks and open issues is a separate job from tracking tasks. The RAID log template covers risks, assumptions, issues and dependencies, and works well beside this project status tracker.
Common mistakes
- Typing a status instead of using the dropdown. A small spelling difference stops the flag and the COUNTIF counts from matching.
- Leaving the due date blank. Without it, the flag stays empty and the task cannot be marked Overdue or Due soon.
- Overwriting formulas in columns A, J and K when pasting data. Paste values only into the input columns.
- Forgetting to set a task to Done. A finished task with an old due date will keep showing Overdue.
- Adding tasks below row 58 without extending the formulas and summary ranges.
- Expecting the flags to change without recalculation. They depend on TODAY(), so they update when the file opens or recalculates.
- Entering % done as a whole number such as 50 when the cells expect a percentage. Format column I as a percentage so the overall progress figure reads correctly.
- Leaving old sample tasks in place. Delete the sample text in the input columns, but keep the formulas in A, J and K.
Excel vs Google Sheets notes
The formulas used here are standard and work in both programs. Data validation lists, conditional formatting and freeze panes are available in each, though the menus are in different places.
| Feature | Excel | Google Sheets |
|---|---|---|
| Dropdowns | Data, Data Validation | Data, Data validation |
| Progress bar for % done | Conditional Formatting, Data Bars | Use a color scale or a SPARKLINE bar instead |
| Freeze panes | View, Freeze Panes | View, Freeze |
| TODAY() | Updates on open and recalculation | Updates on open and on edits |
If your team shares one file and edits at the same time, Google Sheets is easier for live editing. If you prefer to keep files local or use desktop features, stay in Excel.
Other free templates and a pro option
If you track time against tasks, the timesheet template in Excel is a natural companion. You can find more on the free templates page, or read the start here guide if you are new to the site.
If you want charts and a fuller overview across a project, the Project Management Dashboard in Excel is a paid option built for that.
Your next step
Download the tracker, replace the sample website tasks with your own, and set a status for every row. Then filter by owner and run your next status meeting from this one sheet.
Frequently asked questions
How do I make a project tracker in Excel?
Create a table with columns for task, owner, status, start, due and % done. Add dropdowns for status, then use a formula that compares the due date with TODAY() to show a flag like Overdue or On track. The steps above walk through each cell.
How does the status flag work in this template?
The flag in column K checks each task in order: Done, Overdue, Due soon (within 3 days), Blocked, then On track. Overdue and Blocked show red, Due soon amber, Done green and On track blue.
How many tasks can the project tracking template hold?
It holds 50 tasks, in rows 9 to 58 of the Tracker sheet. To add more, extend the formulas and the summary ranges past row 58.
Can I use this task tracker in Google Sheets?
Yes, the formulas work in Google Sheets. The main difference is the % done column, where you can use a color scale or a sparkline bar in place of the Excel data bar.
Why does my finished task still show Overdue?
The status for that task is probably not set to Done. The flag formula checks for Done first, so changing the status in column F to Done switches the flag to green.
Free download
Project Tracker Template (Excel)
Working formulas, sample data and a How to use sheet. Opens in Excel, or import it into Google Sheets.
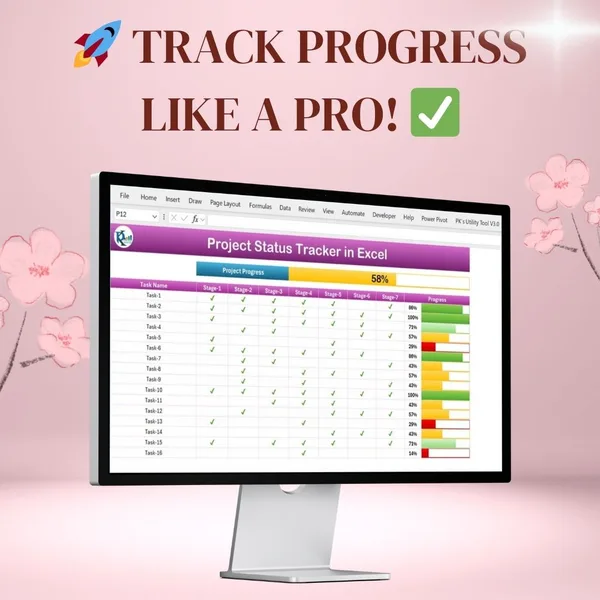
Want the finished version?
Project Progress Tracker in Excel
Colour-coded progress bars and automatic completion percentages.
View the pro template
PK is the founder of PK: An Excel Expert and NextGenTemplates.com and a corporate trainer in Excel, VBA and Power BI. Since 2020 he and his team have built Excel and Google Sheets tutorials and templates for business users, including many project management tools.