
A RACI chart template is a grid that lists tasks down the side and roles across the top, with one letter in each cell to show who is Responsible, Accountable, Consulted or Informed. To build one in Excel, you set up the roles and tasks, add a dropdown for R, A, C and I, and add a formula that checks every task has exactly one A and at least one R. The free template below already has all of this set up.
You can download the free RACI chart template (Excel) below and start filling in your own tasks.
Free download
RACI Chart Template (Excel)
Working formulas, sample data and a How to use sheet. Opens in Excel, or import it into Google Sheets.
What is a RACI chart?
A RACI chart, also called a responsibility assignment matrix, shows who does what on a project. Each task gets a letter for each person or role, so nobody has to guess who owns a decision or who needs to hear about it.
The four letters mean:
- R = Responsible: does the work.
- A = Accountable: owns the result. Only one per task.
- C = Consulted: gives input before the work is done.
- I = Informed: is told once it is done.
Project managers, team leads, PMP learners and freelancers working with clients all use it. It is most useful at kickoff, when a team is new, or when a task keeps falling between two people. If you are studying for the PMP exam, building a chart like this by hand is a good way to remember what each letter means.
Why use a RACI matrix in Excel
Many teams keep responsibilities in a slide or a long email thread. That works until someone changes roles or a new task appears. A RACI matrix in Excel is a single sheet that anyone can open, edit and check.
Excel also lets you add rules. A dropdown stops typos, color makes the pattern visible, and a formula flags rows that break the two main RACI rules. A printed chart cannot do that.
What the RACI matrix Excel template does
The workbook has two sheets: ‘How to use’ and ‘RACI’. The RACI sheet holds the legend in row 4, six roles in C7:H7 and room for 20 tasks in B8:B27. The grid in C8:H27 has a dropdown list (R, A, C, I) and colors each letter: R green, A navy, C amber and I grey.
Two things go beyond a plain grid. Column I checks each row for the two most common RACI errors. Rows 30 to 33 count how many R, A, C and I letters each role carries, so you can see who is overloaded.
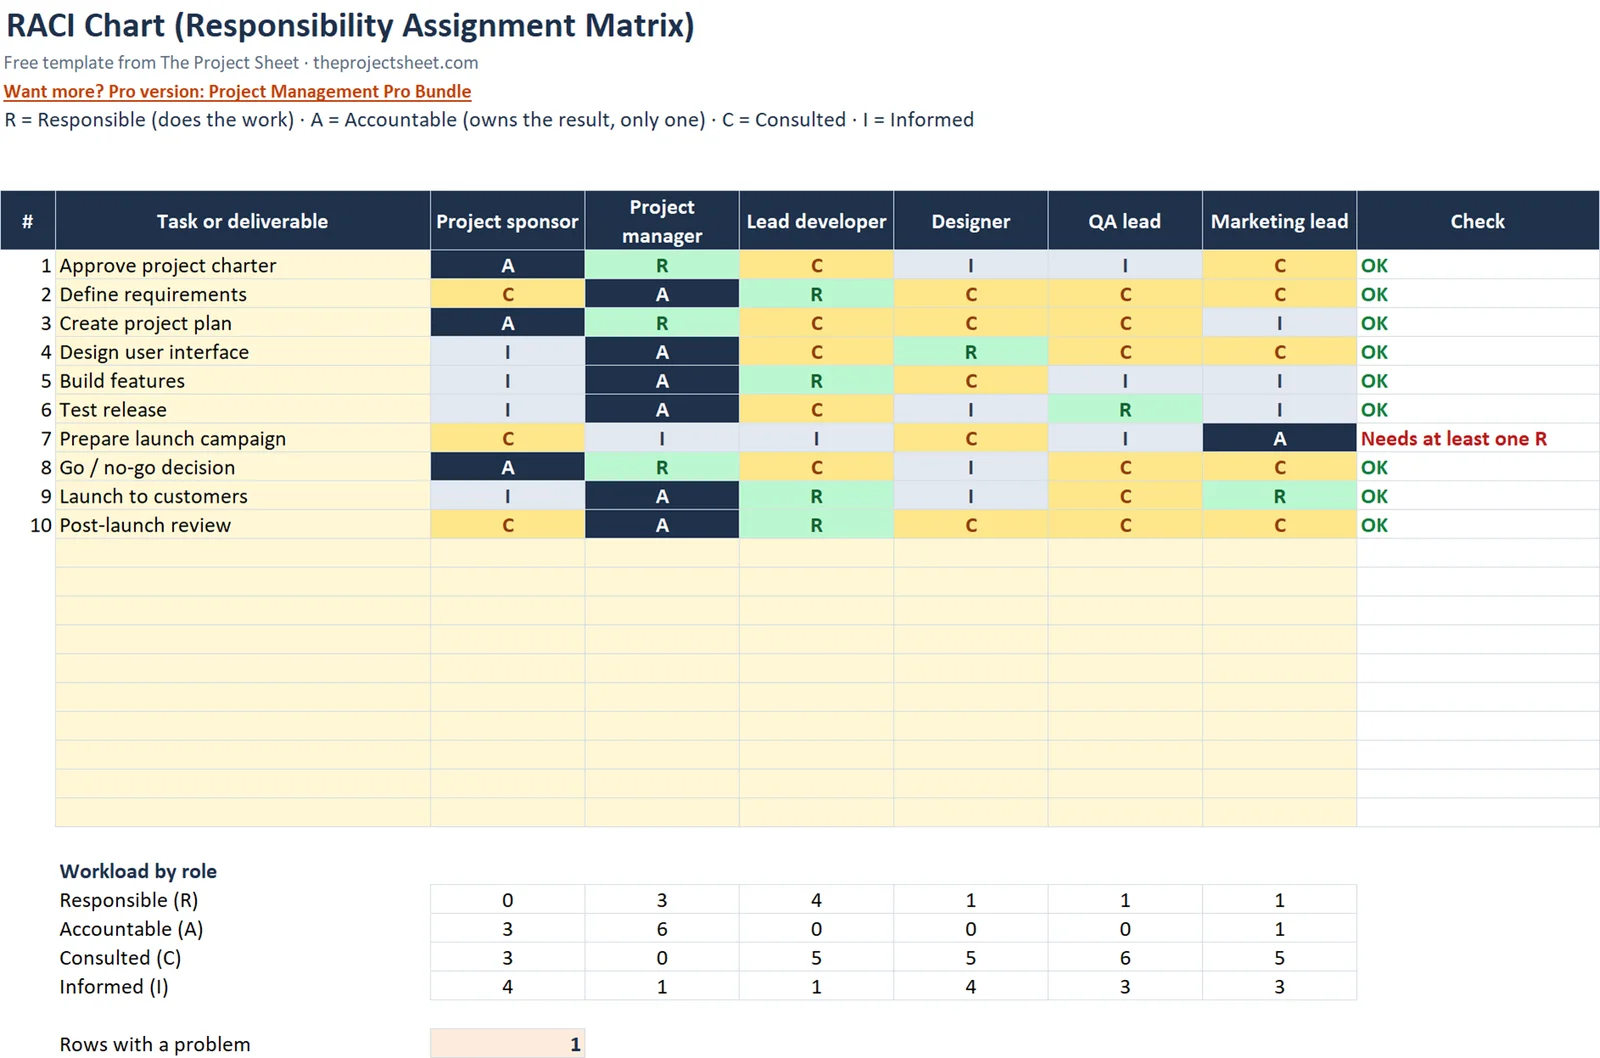
The sample is a product launch with 10 tasks, so you can see a realistic chart before you replace anything with your own work.
Build the RACI chart step by step
You can open the template and edit it, or follow these steps to build the same thing from a blank workbook. Building it once is the quickest way to understand how each part works.
Step 1: Add the legend
In row 4, write the four definitions: R = Responsible (does the work), A = Accountable (owns the result, only one), C = Consulted, I = Informed. Keeping the legend on the sheet means anyone who opens the file can read it without a separate document.
Step 2: List your roles
Type role names in C7:H7. The sample uses Project sponsor, Project manager, Lead developer, Designer, QA lead and Marketing lead. Use roles rather than personal names when you can, because roles stay the same when people change.
If you have more than one person in a role, add the names in a note on the ‘How to use’ sheet or in a separate list. The chart itself stays readable.
Step 3: List your tasks
Put tasks in B8:B27, which gives you 20 rows. Start each with a verb so the owner is easy to picture. The sample has 10 tasks from a product launch: Approve project charter, Define requirements, Create project plan, Design user interface, Build features, Test release, Prepare launch campaign, Go / no-go decision, Launch to customers and Post-launch review.
Keep tasks at a level where one person could reasonably own the result. A task like “Build features” is fine for a overview chart, but you may want to split it if several leads share it.
Step 4: Add the dropdown
Select C8:H27, open Data Validation and choose List. Enter R,A,C,I as the source. Now each cell accepts only those four letters, which removes typos such as “r ” or “Accountable”.
Step 5: Add the color rules
With C8:H27 still selected, create four conditional formatting rules that format cells equal to a letter. Use green for R, navy for A, amber for C and grey for I. The color makes the pattern of ownership visible at a glance, and a row with no green or no navy stands out straight away.
Step 6: Add the check column
In I8, enter this formula and fill it down to I27:
=IF(B8="","",IF(COUNTIF(C8:H8,"A")<>1,"Needs exactly one A",IF(COUNTIF(C8:H8,"R")=0,"Needs at least one R","OK")))
Blank task rows show nothing. A row with no A or more than one A shows “Needs exactly one A”. A row with a single A but no R shows “Needs at least one R”. Anything else shows “OK”.
The order of the tests matters. The formula checks the A count first, so a row with both problems shows the A message. Fix that one, and the R message appears if it still applies.
Step 7: Add the workload counts
In rows 30 to 33, count each letter per role. For the first role in column C, the R count is =COUNTIF(C$8:C$27,"R"). Use the same pattern with “A”, “C” and “I” in the other three rows, then fill across to column H.
The dollar signs lock the row range, so the formula keeps pointing at rows 8 to 27 when you copy it across to the other roles.
Step 8: Count the problems
In C35, enter =COUNTIF(I8:I27,"Needs*"). The wildcard catches both error messages, so one cell tells you how many rows still need fixing. Aim for zero before you share the chart.
RACI chart example with the sample figures
In the sample product launch, most rows show OK. The one exception is ‘Prepare launch campaign’. The Marketing lead is marked A, but nobody is marked R, so the check column shows “Needs at least one R”. It is left that way on purpose so you can see the check working.
Because that is the only flagged row, C35 shows 1. To fix it, change one cell in that row to R. You could give the Marketing lead both A and R, or assign R to another role. The flag turns to OK and C35 drops to 0.
Now look at the other rows. For ‘Approve project charter’, the sponsor would typically be the single A, with the project manager doing the work. For ‘Go / no-go decision’, one person owns the call while others are consulted or informed. Reading the chart row by row like this is the quickest way to test whether it matches how your team really works.
The workload rows work the same way. If one role shows a high R count in row 30 compared with the others, that person carries most of the work, and you may want to move some tasks.
| Check | Where | What it tells you |
|---|---|---|
| Row check | I8:I27 | Exactly one A and at least one R per task |
| Workload counts | Rows 30-33 | How many R, A, C and I each role holds |
| Problem count | C35 | Number of rows still flagged (1 in the sample) |
How to adapt the template
- Rename roles. Overwrite C7:H7. The formulas do not depend on the names.
- Replace the tasks. Overwrite the sample tasks in B8:B27 and clear the letters in the grid.
- Use fewer tasks. Leave unused rows blank. The check column stays empty when the task cell is empty.
- Match it to a phase. Make one copy of the RACI sheet per project phase if responsibilities change between them.
- Use it for client work. Freelancers can list the client as a role, which makes it clear who approves each deliverable.
A RACI chart pairs well with a schedule. If you also need dates, see how to make a Gantt chart in Excel. For tracking progress on the same tasks, the project management template in Excel adds status flags. Risks that come up while assigning owners belong in a RAID log. If the people in your chart log their hours, the timesheet template in Excel covers that.
How to run a RACI session with your team
Filling in the chart alone is faster, but a short group session gives better results. Share the sheet on a screen, go down the task list and ask each person what they expect to do. Disagreements show up quickly, and it is better to find them now than halfway through the project.
- Agree the task list first, before any letters go in.
- Start each row by choosing the A. One name, then move on.
- Add the R or Rs, then C and I.
- Check column I and fix every flag.
- Look at rows 30 to 33 and move work away from anyone who is overloaded.
Save the agreed version with a date in the file name, so you can see later what changed.
Common mistakes
- Two As on one task. When two people are accountable, neither is. Pick one and make the other R or C.
- No R at all. Someone has to do the work. The check column catches this.
- Everyone is C. Consulting too many people slows decisions. Keep C for people whose input changes the outcome.
- Forgetting I. People who are not told about a change often become the source of surprises later.
- Using names that change. A chart full of personal names needs rework each time someone leaves. Roles last longer.
- Never reviewing the chart. Roles shift as a project moves. Review it at each phase change and check the workload rows again.
Excel vs Google Sheets notes
The template is built in Excel, but the same approach works in Google Sheets. The formulas, including COUNTIF with a wildcard, behave the same in both.
- Dropdown: in Google Sheets, use Data, then Data validation, and choose Dropdown with the items R, A, C, I.
- Colors: use Format, then Conditional formatting, and add one rule per letter.
- Sharing: Google Sheets is easier for several people editing at once. Excel is fine if you keep one owner and send updated copies.
If you upload the file to Google Drive and open it as a Sheet, check that the dropdown and colors survived the conversion.
Want more templates?
If you want a wider set of project tools in one download, the Project Management Pro Bundle (9 templates) is available. You can also browse the free templates page, or follow the start here guide if you are new to the site.
Your next step
Open the template, replace the sample tasks with your own, and work down column I until C35 shows 0. Then share the chart with the team and ask each person to confirm their letters.
Frequently asked questions
What is a RACI chart?
A RACI chart is a grid that shows who is Responsible, Accountable, Consulted or Informed for each task in a project. It is also called a responsibility assignment matrix. It helps teams agree who does the work and who owns the result.
How do I make a RACI matrix in Excel?
List roles across the top and tasks down the side, then add a dropdown list of R, A, C and I to the grid using Data Validation. Add conditional formatting for color and a COUNTIF formula to check each row has one A and at least one R. The free template above has all of this built in.
Can a task have more than one person Accountable?
No. Each task should have exactly one A so there is a single owner of the result. The template's check column shows 'Needs exactly one A' when a row has none or more than one.
Can one person be both Responsible and Accountable?
Yes. On small tasks the person who does the work often also owns the result. The template allows this as long as the row still has exactly one A and at least one R.
Does the RACI chart template work in Google Sheets?
Yes. The formulas work the same way, and you can recreate the dropdown with Data validation and the colors with Conditional formatting. Check that both survived if you upload the Excel file and convert it.
Free download
RACI Chart Template (Excel)
Working formulas, sample data and a How to use sheet. Opens in Excel, or import it into Google Sheets.
Want the finished version?
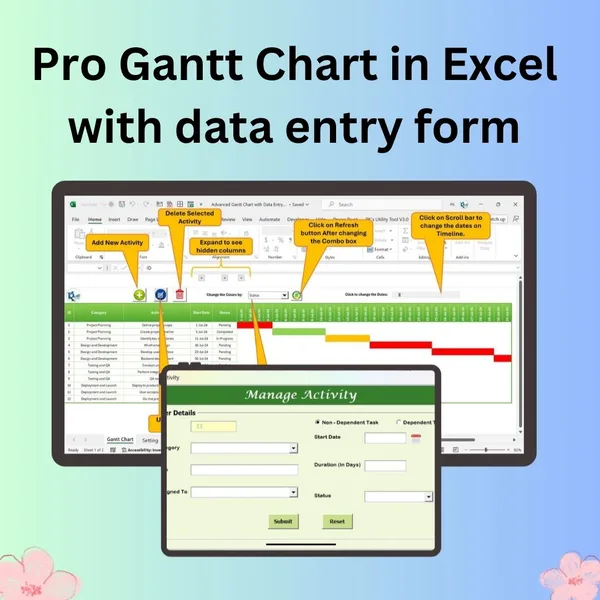
Pro Gantt Chart in Excel with Data Entry Form
Add and update activities through a form while the Gantt chart updates itself.
View the pro template
PK is the founder of PK: An Excel Expert and NextGenTemplates.com and a corporate trainer in Excel, VBA and Power BI. Since 2020 he and his team have built Excel and Google Sheets tutorials and templates for business users, including many project management tools.