
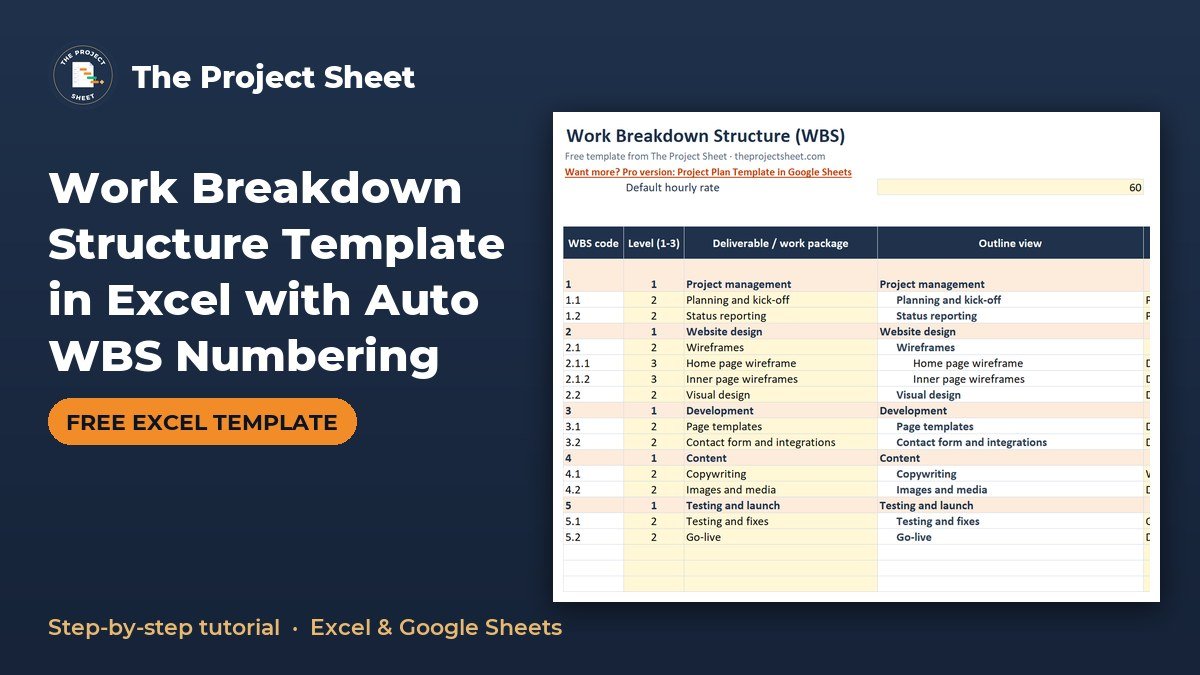
A work breakdown structure template breaks a project into deliverables and smaller work packages, each with a numbered code such as 2.1.1. In Excel, you type a level (1, 2 or 3) next to each item and a formula builds the WBS numbering for you, so you never renumber by hand. This guide shows how to create a WBS that way, with hours and cost rolled up per deliverable.
The free Excel template is below, ready to use with a sample website project.
Free download
Work Breakdown Structure Template (Excel)
Working formulas, sample data and a How to use sheet. Opens in Excel, or import it into Google Sheets.
What this WBS template does and who it is for
The workbook has two sheets: How to use and WBS. On the WBS sheet you list up to 40 items (rows 8 to 47), give each one a level from 1 to 3, and the sheet assigns the code, indents the name, calculates cost and summarizes totals by level-1 deliverable.
It suits project managers who need a quick scope breakdown, PMP learners practicing decomposition, team leads building an estimate, and freelancers who want to show a client what the fee covers. It works as a plain WBS template in Excel with no macros to enable.
A work breakdown structure answers one question: what exactly are we delivering? Dates, sequence and dependencies come later. When the scope is written down as a tree, it is much easier to estimate, to assign owners and to spot work nobody has thought about yet.
How the sheet is laid out
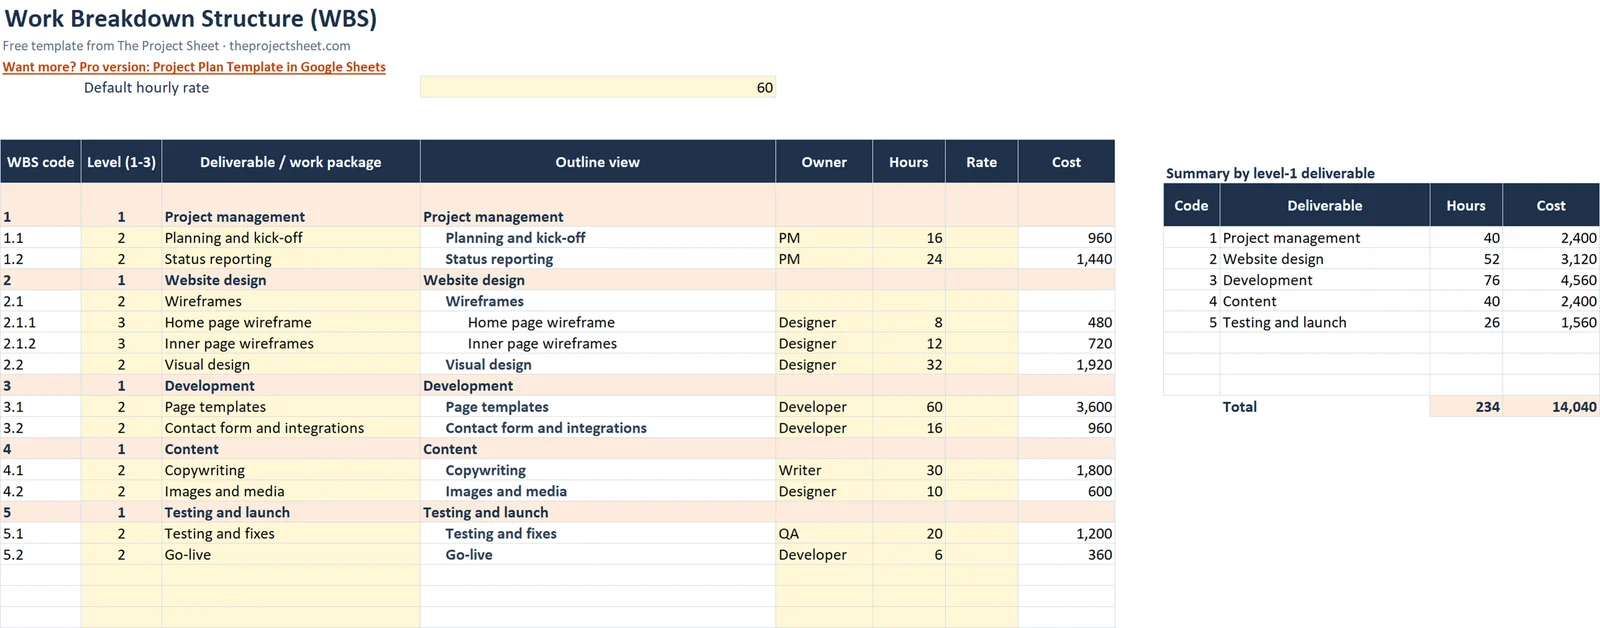
Row 7 holds the headers and rows 8 to 47 hold the items. Cell D4 stores the default hourly rate, set to 60. Here is what each column does.
| Column | Content | Type |
|---|---|---|
| A | WBS code | Formula |
| B | Level (1 to 3) | Input, validated whole number |
| C | Deliverable / work package | Input |
| D | Outline view | Formula |
| E | Owner | Input |
| F | Hours | Input |
| G | Rate (optional override) | Input |
| H | Cost | Formula |
| K, L, M | Hidden counters for levels 1, 2, 3 | Formulas |
Level-1 rows are shaded so the main deliverables stand out when you scroll. The summary block on the right, in O8:R17, shows one line per level-1 deliverable.
The three levels explained
Before building anything, it helps to be clear about what each level means. The template allows three, which is enough for most small and mid-sized projects.
- Level 1 is a major deliverable or phase of the result, such as Website design.
- Level 2 is a sub-deliverable that belongs to a level-1 item, such as Homepage design.
- Level 3 is a work package, the smallest piece you plan to estimate and assign to an owner.
Not every branch needs all three levels. Stop splitting when a piece of work is small enough to estimate with confidence and give to one person.
How to create a WBS in Excel, step by step
Step 1: Set the hourly rate in D4
Type your default hourly rate in D4. The sample uses 60. Any row can override it in column G, for example when a specialist costs more.
Step 2: Enter levels in column B
Level 1 is a major deliverable, level 2 is a sub-deliverable, and level 3 is a work package. Column B only accepts whole numbers from 1 to 3, so a typo such as 4 is rejected.
Step 3: Name each item in column C
Write the deliverable or work package in column C. Use nouns for deliverables ("Homepage design") so the structure describes what you produce, not what you do day to day.
Step 4: Build the counters in K, L and M
The auto WBS numbering relies on three hidden counter columns. Each one tracks how many items have appeared at its level.
- Column K counts level-1 items:
=IF(B9="",K8,IF(B9=1,K8+1,K8)) - Column L counts level-2 items and resets at every level 1:
=IF(B9="",L8,IF(B9=1,0,IF(B9=2,L8+1,L8))) - Column M counts level-3 items and resets at levels 1 and 2:
=IF(B9="",M8,IF(B9<=2,0,M8+1))
Each formula looks at the row above, so the count carries down the list. Blank rows simply pass the previous value along.
Step 5: Build the WBS code in column A
Column A joins the counters according to the level. In row 9 the formula is:
=IF(B9="","",K9&IF(B9>=2,"."&L9,"")&IF(B9=3,"."&M9,""))
A level-1 row shows only K, a level-2 row adds the L counter, and a level-3 row adds M. That produces codes like 1, 1.1 and 2.1.1.
Step 6: Show the outline in column D
Column D indents the name by level: =IF(C8="","",REPT(" ",B8-1)&C8). A level-2 item gets one indent and a level-3 item gets two. This is the column to print or paste into a slide.
Step 7: Add hours and cost
Enter hours in column F. Cost in column H is =IF(F8="","",F8*IF(G8="",$D$4,G8)), which uses the rate in G when you have typed one and the default in D4 otherwise.
Enter hours only on the lowest level of each branch. If you also type hours on a parent row, the summary counts that work twice.
Step 8: Summarize by deliverable
The summary sits in O8:R17, one line per level-1 deliverable. The name comes from INDEX/MATCH on the counter in column K. Hours use =SUMIF($K$8:$K$47,O9,$F$8:$F$47), and cost uses the same SUMIF pointed at column H.
Because the summary matches on the level-1 counter, every row under a deliverable, whatever its level, is added to that deliverable. That is why the lowest-level rule matters.
Work breakdown structure example: a website project
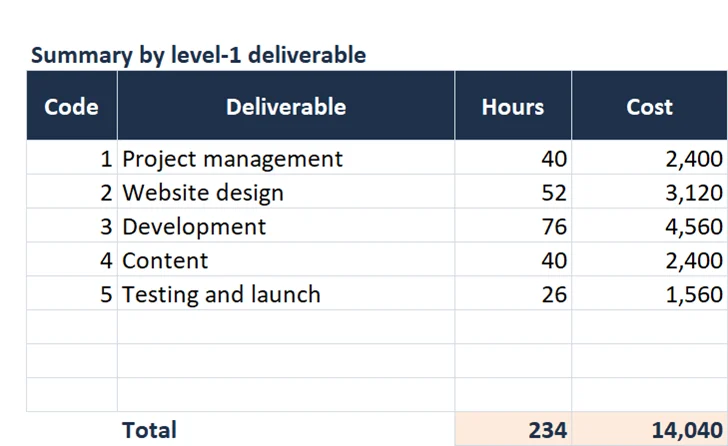
The sample file is a website project with five level-1 deliverables: Project management, Website design, Development, Content, and Testing and launch. The codes it generates are 1, 1.1, 1.2, 2, 2.1, 2.1.1, 2.1.2, 2.2, 3, 3.1, 3.2, 4, 4.1, 4.2, 5, 5.1 and 5.2.
Read the codes as a tree. Code 2 is Website design, 2.1 and 2.2 sit under it, and 2.1 has two level-3 packages (2.1.1 and 2.1.2). The other branches stop at level 2.
The summary rolls up like this, at the default rate of 60 per hour:
| Deliverable | Hours | Cost |
|---|---|---|
| Project management | 40 | 2,400 |
| Website design | 52 | 3,120 |
| Development | 76 | 4,560 |
| Content | 40 | 2,400 |
| Testing and launch | 26 | 1,560 |
| Total | 234 | 14,040 |
Check the math: 40 + 52 + 76 + 40 + 26 gives 234 hours, and 234 times 60 gives 14,040. Development is the largest block at 76 hours, so it is where an estimate error would hurt most.
What the example tells you
A quick read of the summary shows where the effort sits. Development and Website design together account for 128 of the 234 hours. Project management is 40 hours, the same as Content, which is a useful sanity check: management effort is often forgotten, and having it as its own level-1 deliverable keeps it visible.

How to adapt the template
- Replace the sample rows. Clear columns B, C, E, F and G for the sample items and type your own. Leave the formulas in A, D, H and the counters alone.
- Insert rows inside the table. Right-click a row between existing items and insert. The numbering updates itself, so adding a new work package under 2.2 shifts later codes without any editing.
- Use different rates. Type a rate in column G for any row that should not use the default in D4. A designer and a developer rarely cost the same.
- Assign owners. Column E holds one name per row. Filling it in for every level-3 or lowest-level item shows quickly who carries the most work.
- Apply the 100% rule. The WBS should cover all the work of the project, and nothing outside it. If a task does not fit under any level-1 deliverable, either a deliverable is missing or the task is out of scope.
- Feed other documents. Use the level-1 deliverables as the phases in a project timeline template, and report progress against them in a weekly project status report.
Tips for a better breakdown
Start from the top. Write the five or six main deliverables first, then split each one. Working top-down stops you from listing tasks in the order you happen to think of them.
Ask a second person to read the list. A fresh reader will quickly notice missing pieces, which is the main reason the 100% rule exists. Walk through each level-1 item and ask whether finishing its children would really complete it.
Keep names short and parallel. "Homepage design" and "Blog template design" read better in the outline column than long sentences, and they fit on a slide.
Common mistakes
- Entering hours on parent rows. The SUMIF totals add every row in the group, so parent hours double count.
- Starting with a level 2 or 3 row. The first item should be level 1, otherwise the counters have no parent to build from.
- Skipping levels. Going from level 1 straight to level 3 produces a code like 1.0.1, which confuses readers.
- Writing tasks instead of deliverables. A WBS describes what the project produces. Sequencing and dates belong in a schedule.
- Typing over formulas. Overwriting column A with a manual code stops that row from following the numbering.
- Forgetting the 40-item limit. The table runs to row 47. If your project is bigger, break it into one WBS per major deliverable, or extend the formulas down.
Excel vs Google Sheets
The formulas used here (IF, REPT, SUMIF, INDEX and MATCH) work the same way in both programs. In Google Sheets, upload the file to Drive and open it as a Sheet. Check that the validation on column B and the hidden columns K to M came across.
Hiding columns is the same in both: select them, right-click and choose Hide. REPT indents may look slightly different depending on the font, so adjust the number of spaces if you need a wider indent.
If your team plans lessons after delivery, a lessons learned log pairs well with a WBS, since you can reference the code of the work package where an issue arose. Teams running sprints may also like the burndown chart in Excel.
Want a full plan around your WBS?
If you would like a larger planning workbook, the Project Plan Template in Google Sheets is a paid option. You can browse more topics in the pro templates by topic list, or stay with the free templates page.
Next step: download the file, replace the five sample deliverables with your own, and check that the total hours at the bottom of the summary match your estimate. New to the site? The start here guide shows where to go next.
Frequently asked questions
What is a work breakdown structure template?
It is a worksheet that splits a project into deliverables and smaller work packages, each with a numbered code. This template adds owners, hours and cost, and totals them by level-1 deliverable.
How do I create a WBS in Excel?
List your items, enter a level from 1 to 3 beside each one, and let formulas build the codes from hidden counter columns. Then add hours on the lowest level and the sheet calculates cost and summary totals.
How does WBS numbering work in this template?
Three hidden columns count level-1, level-2 and level-3 items, resetting the lower counters when a higher level starts. Column A joins them into codes such as 1, 1.1 and 2.1.1. Inserting a row inside the table renumbers everything.
Why enter hours only on the lowest level?
The summary adds up every row in a deliverable group. If a parent row also has hours, that work is counted twice and the total is inflated.
What is the 100% rule in a WBS?
The WBS should include all the work of the project and nothing outside it. If a piece of work does not fit under any deliverable, a deliverable is missing or the work is out of scope.
Free download
Work Breakdown Structure Template (Excel)
Working formulas, sample data and a How to use sheet. Opens in Excel, or import it into Google Sheets.
Want the finished version?
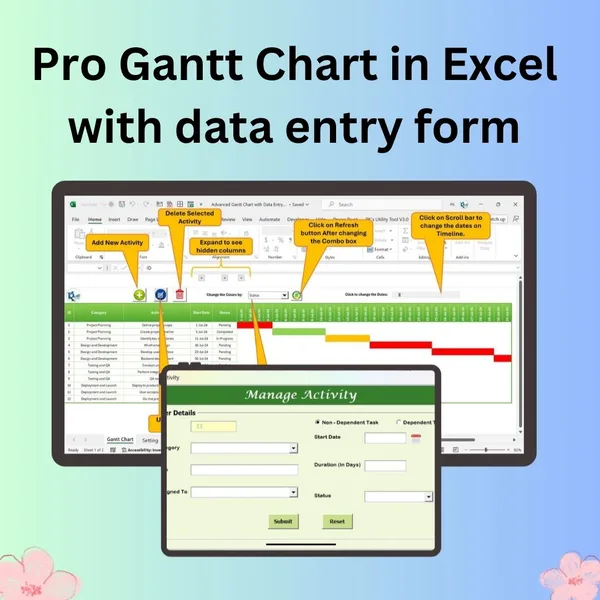
Pro Gantt Chart in Excel with Data Entry Form
Add and update activities through a form while the Gantt chart updates itself.
View the pro template
PK is the founder of PK: An Excel Expert and NextGenTemplates.com and a corporate trainer in Excel, VBA and Power BI. Since 2020 he and his team have built Excel and Google Sheets tutorials and templates for business users, including many project management tools.