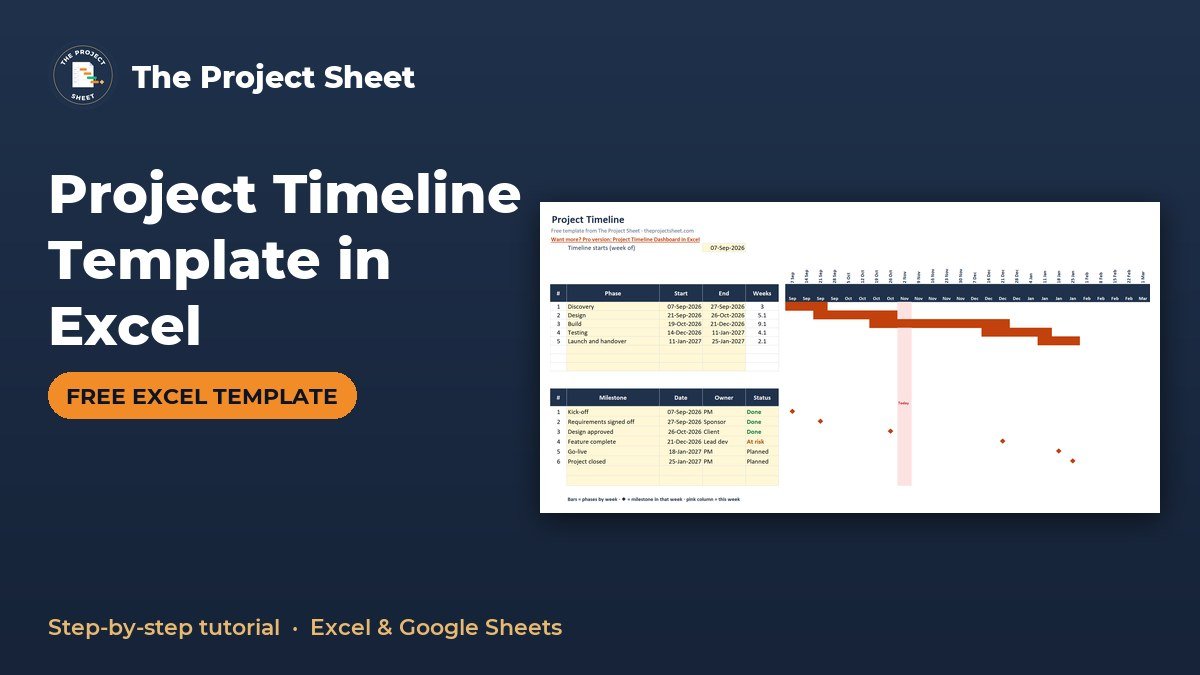
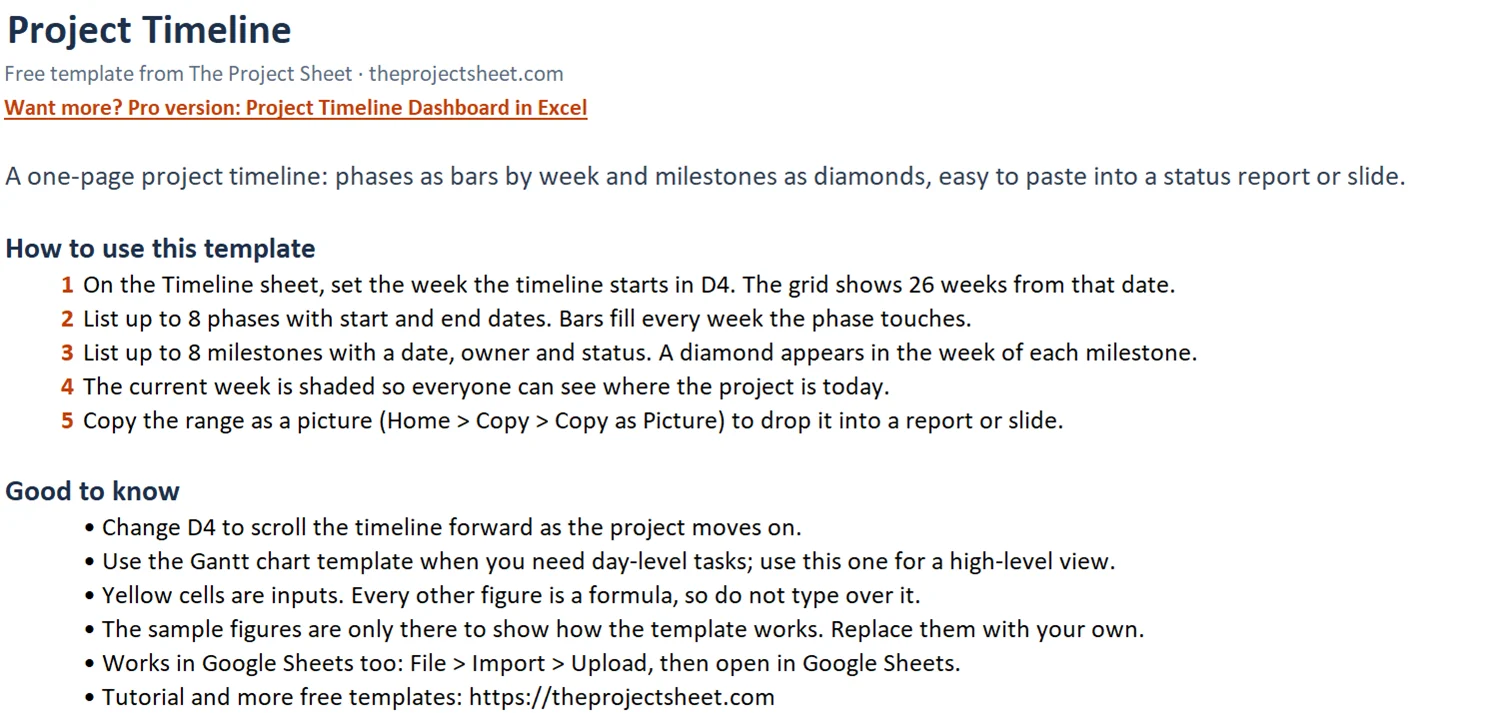
A project timeline template shows your project phases and milestones across weeks on a single page. In Excel you set a start date, list each phase with a start and end date, and use conditional formatting to fill the weeks each phase covers. Milestones appear as diamonds in the week they fall due.
The free project timeline template is below, already built with sample data you can replace.
Free download
Project Timeline Template (Excel)
Working formulas, sample data and a How to use sheet. Opens in Excel, or import it into Google Sheets.
What this project timeline template does
The workbook has two sheets: How to use and Timeline. The Timeline sheet shows 26 weekly columns (G to AF), up to 8 phases, and up to 8 milestones, each with an owner and a status. A pink fill marks the current week, so anyone opening the file can see where the project stands today.
It is built for project managers, team leads, PMP learners and freelancers who need a one-page overview for a sponsor, a client or a slide. If you have searched for a milestone timeline template or a project roadmap template in Excel, this is the same idea: a high-level view of the project, not a task list.
How to read the finished sheet
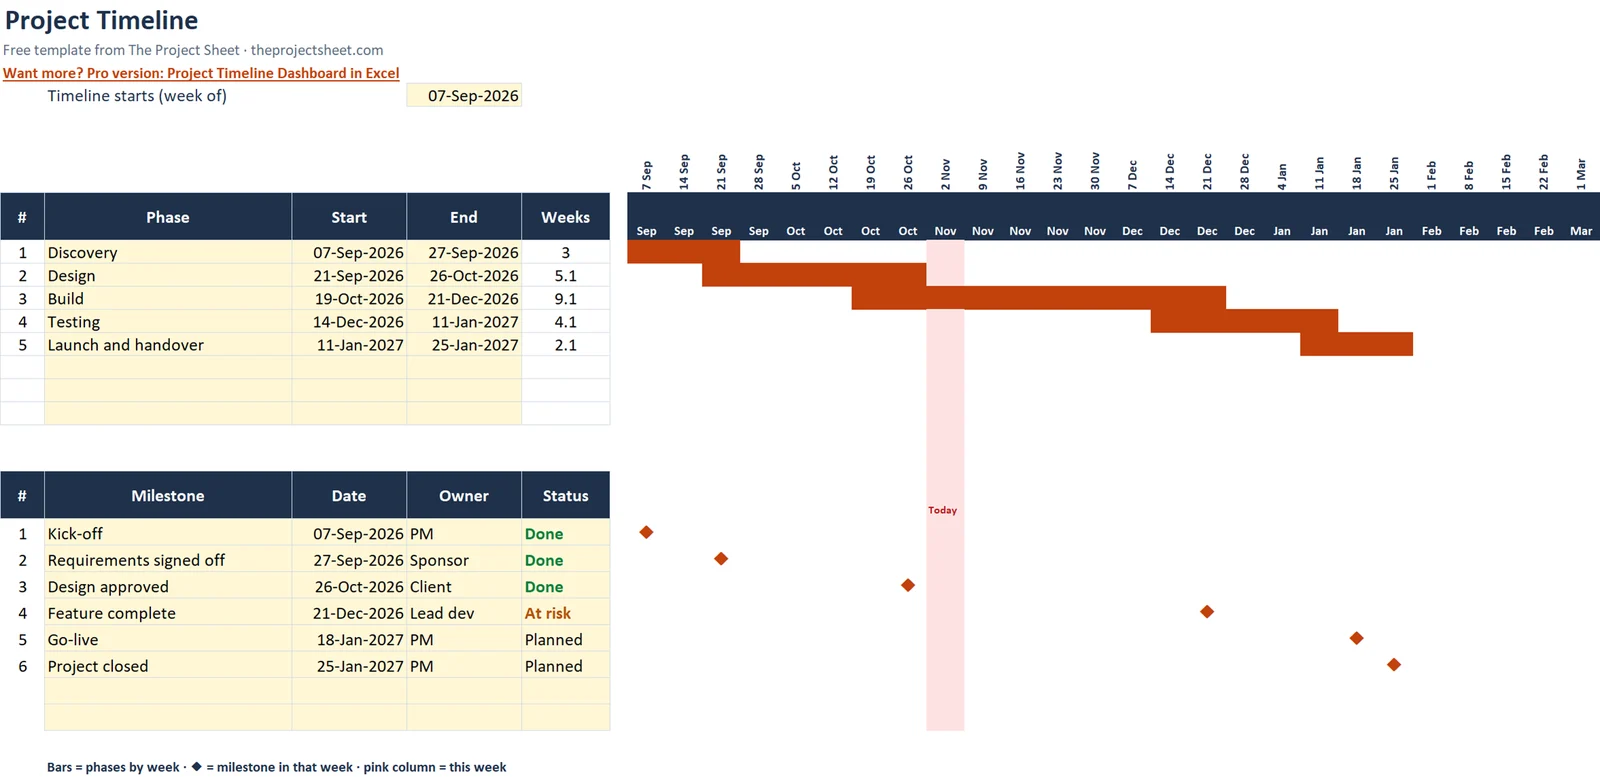
The top of the grid holds the weekly dates, with the month name above each one. Below that, the phases table sits on the left and its bars run across the grid on the right. Each filled cell means the phase is active during that week.
Further down, the milestones table lists each milestone with a date, an owner and a status. A diamond sits in the week that contains the date. Between the two tables, row 18 shows the word "Today" above the current week, so you can see at once which phases are running and which milestones are coming up.
Because everything is weekly, the sheet stays readable when you paste it into a slide. Nobody has to zoom in to find a date.
Timeline vs Gantt chart
This sheet works in weeks and shows phases and milestones only. A Gantt chart goes down to day-level tasks. Use the timeline when you want the big picture on one page, and use the Gantt template when you need to schedule individual tasks.
| Question | Timeline template | Gantt chart |
|---|---|---|
| Time unit | Weekly | Day-level |
| What it shows | Phases and milestones | Individual tasks |
| Best for | One-page overview | Detailed scheduling |
If you still need to list the work itself, start with a work breakdown structure template with auto numbering, then roll the work up into phases here.
How to create a project timeline in Excel, step by step
Follow these steps to build the sheet yourself, or to understand how the free file works before you edit it. Each step names the cells used in the template.
Step 1: Set the start date
In D4, labeled "Timeline starts (week of)", enter your start date. The sample uses 07-Sep-2026. Every date in the grid is calculated from this one cell, so changing it moves the whole timeline.
Pick the first day of the week you want the grid to begin with. The first column then starts on exactly that day, and each column after it is seven days later.
Step 2: Build the weekly date row
In G6 enter =$D$4. In H6 enter =G6+7 and copy it across to AF6. That gives 26 weekly columns. Rotate the dates so they fit in narrow columns.
Adding 7 to the previous cell is all the logic the date row needs. Because G6 points at D4, you never type a date into the grid by hand.
Step 3: Add month names
In row 7, use =TEXT(G6,"mmm") and copy it across to AF7. The month label sits above each week and makes the grid easy to scan.
Step 4: Create the phases table
Use rows 8 to 15 for up to 8 phases. The columns are the number, the phase name, the start date, the end date and the weeks. Start is in column C and end is in column D. In the weeks column, enter =ROUND((D8-C8+1)/7,1) and copy it down.
The formula counts both the first and last day, divides by 7, and rounds to one decimal. A phase that runs 21 days shows 3, and one that runs a few days over a whole number of weeks shows a figure such as 5.1.
Step 5: Draw the phase bars
Select G8:AF15 and add a conditional formatting rule that uses a formula:
=AND($C8<>"",$D8<>"",G$6<=$D8,G$6+6>=$C8)
Choose a fill color. A week fills in when it overlaps the phase dates, and rows with no dates stay blank. The dollar signs matter: $C8 and $D8 lock the columns so every cell in a row reads the same start and end, while G$6 locks the row so every cell in a column reads the same week date.
Step 6: List the milestones
Rows 19 to 26 hold the milestones. Enter the milestone name, the date, the owner and the status. Add a dropdown for status with four options: Planned, At risk, Done and Missed. Then add color rules so each status is easy to spot.
A dropdown keeps the wording consistent, which matters when you want to filter or count statuses later.
Step 7: Place the diamonds
In each grid cell of rows 19 to 26, starting at G19, enter:
=IF(AND($C19<>"",$C19>=G$6,$C19<G$6+7),"◆","")
Copy it across and down. The milestone date is in column C, and a diamond appears in the week that contains it. If the date cell is empty, the row stays blank.
Step 8: Highlight the current week
Row 18 shows the word "Today" above the current week, with a pink fill. The conditional formatting rule is =AND(TODAY()>=G$6,TODAY()<G$6+7). It updates every time you open the file, so you never move the marker yourself.
Worked example with the sample data
The sample project starts the week of 07-Sep-2026. These are the phases, with weeks calculated by the formula from step 4.
| Phase | Start | End | Weeks |
|---|---|---|---|
| Discovery | 07-Sep-2026 | 27-Sep-2026 | 3 |
| Design | 21-Sep-2026 | 26-Oct-2026 | 5.1 |
| Build | 19-Oct-2026 | 21-Dec-2026 | 9.1 |
| Testing | 14-Dec-2026 | 11-Jan-2027 | 4.1 |
| Launch and handover | 11-Jan-2027 | 25-Jan-2027 | 2.1 |
Take Discovery as a check on the weeks formula. It runs from 07-Sep to 27-Sep, which is 21 days including both ends. Dividing 21 by 7 gives 3 weeks. Design runs from 21-Sep to 26-Oct, which is 36 days, and 36 divided by 7 rounds to 5.1.
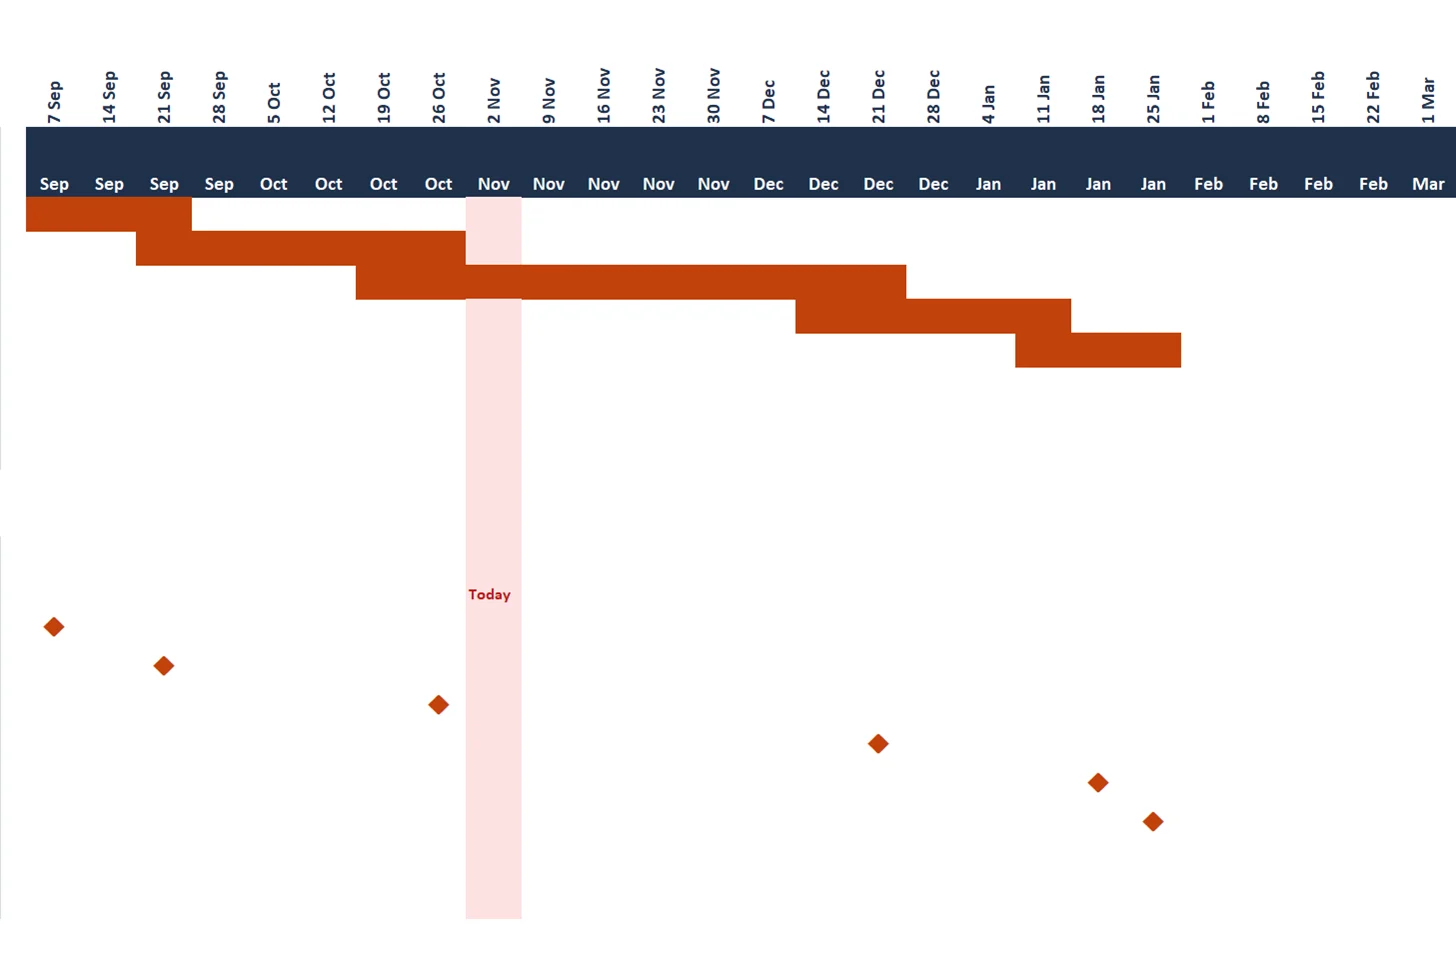
The phases overlap on purpose. Design starts on 21-Sep, the same week Discovery ends, and Build starts on 19-Oct while Design is still running. Testing begins on 14-Dec before Build closes on 21-Dec. A timeline shows this overlap clearly, which a plain list of dates does not.
The milestones in the sample are:
- Kick-off, 07-Sep, Done
- Requirements signed off, 27-Sep, Done
- Design approved, 26-Oct, Done
- Feature complete, 21-Dec, At risk
- Go-live, 18-Jan-2027, Planned
- Project closed, 25-Jan-2027, Planned
Compare these with the phases. Kick-off matches the start of Discovery. Requirements signed off matches the end of Discovery, Design approved matches the end of Design, Feature complete matches the end of Build, and Project closed matches the end of Launch and handover. Go-live on 18-Jan-2027 sits inside the final phase.
That comparison is a useful habit. If a milestone date sits far from any phase boundary, ask why it is there, or whether a phase date needs to move.
Notice also the status of Feature complete. It is At risk, and it is the end of the 9.1-week Build phase that overlaps with Testing. A reader of the one-page view can spot that the Testing phase starts a week before the at-risk date, and that is the kind of conversation this sheet is meant to start.
How to adapt the template
- Change
D4to your own start week and replace the sample phases and milestones. - Keep phases to the 8 rows available. If you have more work than that, group related work into one phase.
- Keep milestones to the 8 rows available and choose the ones a sponsor would ask about, such as approvals, go-live and close.
- Rename the status options if your team uses different words, and update the color rules to match.
- Copy the finished sheet as a picture and paste it into a slide or a weekly report. It fits well beside a one-page weekly status report.
- When a milestone is At risk or Missed, record the cause. A lessons learned log is a good place for it.
If your project is shorter than 26 weeks, leave the extra columns empty or hide them before you copy the picture. If it is longer, split it into two timelines, with the second one starting at a later date in D4.
Common mistakes
- Typing text instead of dates. If a start or end cell holds text, the bar will not draw and the weeks formula will fail. Check that the cells are formatted as dates.
- Overwriting formulas in the grid. The diamond formulas and the date row should stay as formulas. Type only in the input cells.
- Forgetting the 26-week limit. The grid covers 26 weeks from the start date. Anything beyond that will not appear.
- Putting the end date before the start date. The bar will not fill correctly and the weeks column will show a odd result. Check both dates when a bar looks wrong.
- Using the timeline for task detail. If you list tasks here, the sheet gets crowded. Move to a Gantt view for that.
- Not updating status. A timeline with old statuses misleads readers. Review it each week.
Excel vs Google Sheets
The template is built in Excel. In Google Sheets, the functions TEXT, ROUND, IF, AND and TODAY work the same way. Conditional formatting with a custom formula and dropdown lists are available in both, though you may need to recreate the rules after importing the file.
After you upload the file, check the colors, the rotated date row and the status dropdown. If a bar is missing, open the conditional formatting rule and confirm that the range is G8:AF15 and the formula is unchanged.
For projects that run in sprints, a burndown chart in Excel tracks progress inside a phase, while this timeline covers the whole project.
Want more than the free version?
If you would like a fuller dashboard, the Project Timeline Dashboard in Excel is a paid option. You can also browse more free templates, the pro templates by topic, or the start here guide.
Your next step: open the file, set D4 to your start week, and replace the five sample phases with your own.
Frequently asked questions
How do I create a project timeline in Excel?
Enter a start date, build a row of weekly dates by adding 7 to the previous cell, and list your phases with start and end dates. Then use a conditional formatting formula to fill the weeks each phase covers. Add milestones with a formula that places a diamond in the matching week.
What is the difference between a project timeline and a Gantt chart?
A timeline is a one-page, weekly view of phases and milestones. A Gantt chart goes down to day-level tasks. Use the timeline for sponsors and slides, and a Gantt for detailed scheduling.
How many phases and milestones can the template hold?
The template holds up to 8 phases in rows 8 to 15 and up to 8 milestones in rows 19 to 26. The grid shows 26 weekly columns from the start date.
Can I use this project timeline template in Google Sheets?
Yes. The formulas used are standard and work in Google Sheets. You may need to recreate the conditional formatting and dropdown rules after importing, and check the date formatting.
How does the template show the current week?
Row 18 shows the word Today with a pink fill above the current week. It uses a TODAY() formula in conditional formatting, so it updates each time you open the file.
Free download
Project Timeline Template (Excel)
Working formulas, sample data and a How to use sheet. Opens in Excel, or import it into Google Sheets.
Want the finished version?
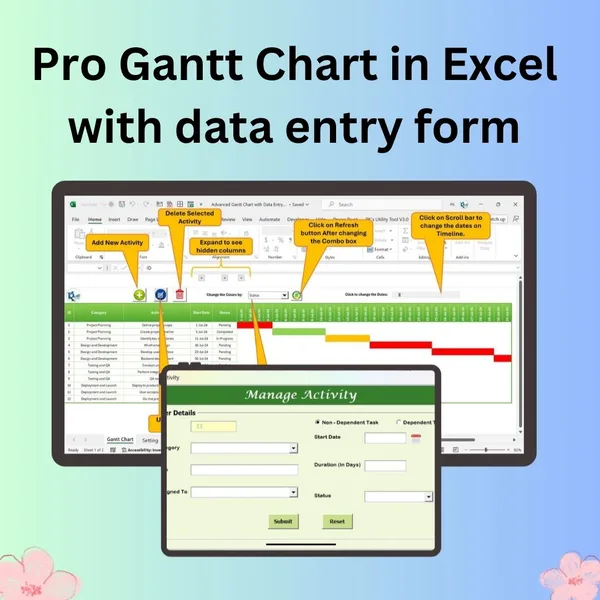
Pro Gantt Chart in Excel with Data Entry Form
Add and update activities through a form while the Gantt chart updates itself.
View the pro template
PK is the founder of PK: An Excel Expert and NextGenTemplates.com and a corporate trainer in Excel, VBA and Power BI. Since 2020 he and his team have built Excel and Google Sheets tutorials and templates for business users, including many project management tools.