

A RAID log is a single list where a project team records its Risks, Assumptions, Issues and Dependencies, each with an owner, a score and an action. To build one in Excel, you set up columns for type, description, owner, likelihood, impact and status, then add formulas that score and rate each item. The free RAID log template is below, already built with the formulas described in this guide.
Free download
RAID Log Template (Excel)
Working formulas, sample data and a How to use sheet. Opens in Excel, or import it into Google Sheets.
What a RAID log does and who it is for
If you are asking what is a RAID log, it is a shared register that keeps four kinds of project concern in one place instead of four separate documents. The four types are easy to mix up, so the template uses these definitions:
- Risk: something that might happen.
- Assumption: something believed to be true but not confirmed.
- Issue: something that is already happening.
- Dependency: something the project relies on from other people or teams.
This RAID log in Excel suits project managers, team leads, PMP learners and freelancers who need a simple record they can review in a weekly meeting. It works as a risk register template in Excel and as an issue log template at the same time, because both live on one sheet and are filtered by type.
Keeping everything on one sheet has a practical benefit. When someone asks “what could stop us this month?”, you open one file and filter, instead of searching through meeting notes, email threads and a separate issue list.

How the template is laid out
The workbook has two sheets: How to use and RAID Log. On the RAID Log sheet the header sits in row 7 and the items run from row 8 to row 47, so you have room for 40 items. A summary block sits in N7:O14 beside the log.
| Column | Field | What it holds |
|---|---|---|
| A | ID | Automatic, such as R-01 or I-01 |
| B | Type | Dropdown: Risk, Assumption, Issue, Dependency |
| C | Description | Short plain-text statement |
| D | Owner | Person responsible |
| E | Date raised | When it was logged |
| F, G | Likelihood, Impact | Whole numbers 1 to 5 |
| H | Score | Likelihood times impact |
| I | Rating | High, Medium or Low |
| J | Response or action | What you will do about it |
| K | Due date | Turns red when past and not closed |
| L | Status | Open, In progress, Closed |
Columns A, H and I are calculated, so you never type in them. Everything else is yours to fill in. That split keeps the data entry short: for a new item you choose a type, write a description, name an owner and give two numbers.
Build it step by step
Step 1: Set up the headers
On a sheet named RAID Log, type the column names from the table above into row 7, A7 through L7. Leave rows 8 to 47 for your items. Keep one item per row so sorting and filtering stay reliable.
Rows 1 to 6 are free for a title, the project name and a short note on how your team scores. Having the scoring rule written at the top of the sheet saves arguments later.
Step 2: Add the type dropdown
Select B8:B47 and add a data validation list with four values: Risk, Assumption, Issue, Dependency. The type drives the automatic ID, so every row needs one of these four words spelled exactly the same way.
Step 3: Generate the ID automatically
In A8 enter this formula and copy it down to A47:
=IF(B8="","",LEFT(B8,1)&"-"&TEXT(COUNTIF(B$8:B8,B8),"00"))
It takes the first letter of the type and counts how many times that type has appeared so far. You get R-01, R-02, A-01, I-01 and D-01 without typing them. The row stays blank until you choose a type.
The range B$8:B8 is anchored at the top and grows as the formula is copied down. That growing range is what makes the second risk become R-02 and the third R-03.
Step 4: Restrict likelihood and impact
Select F8:G47 and set data validation to whole numbers between 1 and 5. This stops a stray 7 or a decimal from skewing the score. Use 1 for very low and 5 for very high, and agree what those mean with your team before you start scoring.
For example, you might decide that impact 5 means the launch date moves, and impact 1 means a small inconvenience. The exact wording is up to you. What matters is that everyone uses the same scale.
Step 5: Calculate the score
In H8 enter:
=IF(OR(F8="",G8=""),"",F8*G8)
The score stays empty until both likelihood and impact are filled in. Copy it down to H47. Because both inputs run from 1 to 5, the score can range from 1 to 25.
Step 6: Turn the score into a rating
In I8 enter:
=IF(H8="","",IF(H8>=15,"High",IF(H8>=8,"Medium","Low")))
A score of 15 or more is High, 8 to 14 is Medium, and anything lower is Low. Add conditional formatting to I8:I47 so High is red, Medium is amber and Low is green.
| Score | Rating | Colour |
|---|---|---|
| 15 or more | High | Red |
| 8 to 14 | Medium | Amber |
| Below 8 | Low | Green |
Step 7: Add the response, due date and status
Column J is free text for the action you will take. Put dates in K and set L8:L47 to a dropdown with Open, In progress and Closed. Then add two conditional formatting rules: turn the due date in K red when it is in the past and the status is not Closed, and grey out the whole row when the status is Closed.
Write the response as a verb phrase, such as “confirm backup developer” or “ask hosting team to upgrade server”. A response that starts with a verb is easier to check off than a general comment.
Step 8: Build the summary
In the block at N7:O14, count open items by type with this formula, changing the word “Risk” for each type:
=COUNTIFS(B$8:B$47,"Risk",L$8:L$47,"<>Closed")
Add a line that counts open items rated High, and one for overdue actions:
=SUMPRODUCT((K8:K47<>"")*(K8:K47<TODAY())*(L8:L47<>"Closed"))
The overdue formula only counts rows that have a due date, are past it and are not closed. A row with no due date is ignored, so fill in column K for anything you want the summary to watch.
Worked example: a website project
The template ships with 7 sample items for a website project. Two show how the scoring works:
- R-01, “Key developer may be unavailable during build phase”: likelihood 3 times impact 4 gives a score of 12, rated Medium.
- I-01, “Staging server is slow and blocks testing”: likelihood 5 times impact 3 gives 15, rated High.
The summary then reads: Risks 3, Assumptions 1, Issues 1 and Dependencies 1 open, with 3 open high-rated items. Notice that I-01 is an issue, so it is already happening. You would usually handle it before a Medium risk like R-01, even though both are on the same list.
Look at how the numbers differ. R-01 has a lower likelihood than I-01 because the developer might still be available, while the slow server is a certainty. The impact is actually higher on R-01 (4 against 3). A single score hides that detail, so read the description and the response beside the rating before you decide what to do first.
To see the formulas react, change the likelihood on R-01 from 3 to 4. The score becomes 16, the rating flips to High, and the count of open high-rated items in the summary goes up by one. Change it back when you are done.
Running a weekly review with the log
A log only helps when people look at it. A short, regular routine is enough:
- Check the summary first: open items by type, open high-rated items and overdue actions.
- Sort or filter to the red rows and ask each owner for an update.
- Look at anything with a red due date in column K and either finish it, move the date or close it.
- Review the assumptions. Each one should either be confirmed and closed, or turned into a risk if it looks shaky.
- Add new items raised during the meeting, so nothing lives only in someone’s notes.
Fifteen minutes is often enough for a small project. Larger projects may need longer, but the order stays the same: summary, red items, overdue dates, assumptions, new items.
How to adapt it
- Change the High and Medium thresholds (15 and 8) in the rating formula if your team scores differently.
- Replace the owner column with a dropdown of your team names.
- Extend the formulas below row 47 if you need more than 40 items, and update the ranges in the summary to match.
- Filter column B to Risk and use it as a risk register template in Excel, or filter to Issue for a standalone issue log template.
- Add a column for a project phase or workstream if you run several streams in one file.
- Pair it with a RACI chart template so every owner in column D has a clear role.
If you change a threshold, update the note at the top of the sheet as well, so readers know what red means. When you extend the log past row 47, remember that the summary formulas still point at rows 8 to 47 until you edit them.
Dependencies often have dates attached, so it helps to see them next to your schedule. Our guide to making a Gantt chart in Excel shows how to build that view. For overall status, the project management template in Excel gives you a tracker with status flags.
Common mistakes
- Mixing up risks and issues. If it has already happened, log it as an Issue. If it might happen, it is a Risk. When a risk occurs, close it and open a new issue so the history stays clear.
- Leaving assumptions untested. Give each assumption an owner and a due date to confirm it, otherwise it quietly becomes a risk.
- No owner. An item without a name in column D rarely gets an action.
- Vague descriptions. “Server problems” tells nobody anything. Say what is wrong and what it affects.
- Deleting closed items. Keep them with the status Closed. The grey rows give you a history, and the summary ignores them.
- Typing over formulas. Columns A, H and I are calculated. Overwriting them breaks the ID, score and rating.
- Misspelling the type. The dropdown prevents it. If you paste values over column B, the ID and summary counts may stop matching.
- Never reviewing the log. A RAID log only helps if you look at it on a regular schedule, such as in your weekly status meeting.
Excel vs Google Sheets
The formulas work in both tools. In Excel the template uses the file as it is. In Google Sheets, upload the file and open it as a Sheet, then check that the dropdowns and conditional formatting came across.
| Feature | Excel | Google Sheets |
|---|---|---|
| ID, score and rating formulas | Work as written | Work as written |
| Dropdowns | Data validation list | Dropdown via Data validation |
| Overdue count with TODAY() | Recalculates when opened | Recalculates automatically |
| Sharing | Send the file or use OneDrive | Share a link for live editing |
If your team edits the log together, Google Sheets is usually easier. If you work alone or offline, Excel is fine. Either way, keep one master copy so people do not update different versions.
Want more than a basic log?
If you prefer a Google Sheets tracker focused on issues, the Project Issue Tracker in Google Sheets is a paid option. You can also browse pro templates by topic.
Your next step
Download the file, delete the 7 sample rows and log your own project’s top five concerns today. Then book a 15-minute slot each week to review the summary. For more spreadsheets like this one, see the free templates page or the start here guide.
Frequently asked questions
What is a RAID log?
A RAID log is one list that records a project's Risks, Assumptions, Issues and Dependencies. Each item has an owner, a rating and an action so the team can review them together.
What is the difference between a risk and an issue?
A risk is something that might happen, while an issue is already happening. In the template, you pick the type in column B, and the ID changes to R- or I- automatically.
How do you score risks in a RAID log in Excel?
Enter likelihood and impact as whole numbers from 1 to 5, then multiply them. In this template a score of 15 or more is High, 8 to 14 is Medium, and lower is Low.
Can I use this as a risk register template in Excel?
Yes. Filter the Type column to Risk to see only risks, with their scores, ratings, owners and responses. The same sheet works as an issue log template when you filter to Issue.
How many items does the RAID log template hold?
It holds 40 items, in rows 8 to 47 of the RAID Log sheet. You can copy the formulas further down if you need more.
Free download
RAID Log Template (Excel)
Working formulas, sample data and a How to use sheet. Opens in Excel, or import it into Google Sheets.
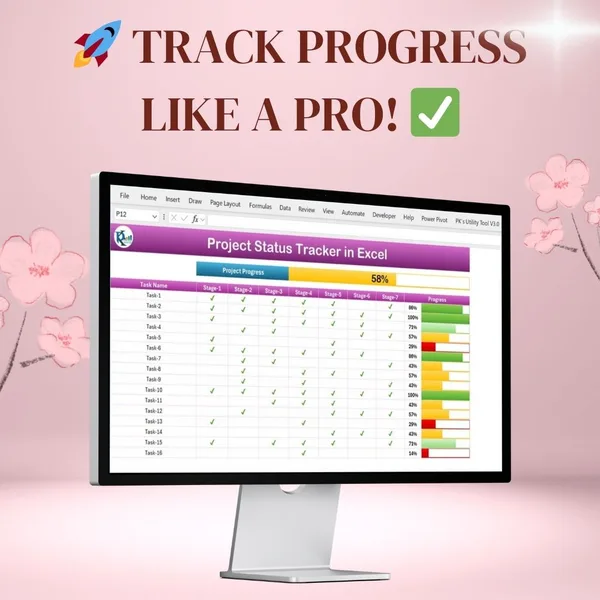
Want the finished version?
Project Progress Tracker in Excel
Colour-coded progress bars and automatic completion percentages.
View the pro template
PK is the founder of PK: An Excel Expert and NextGenTemplates.com and a corporate trainer in Excel, VBA and Power BI. Since 2020 he and his team have built Excel and Google Sheets tutorials and templates for business users, including many project management tools.