
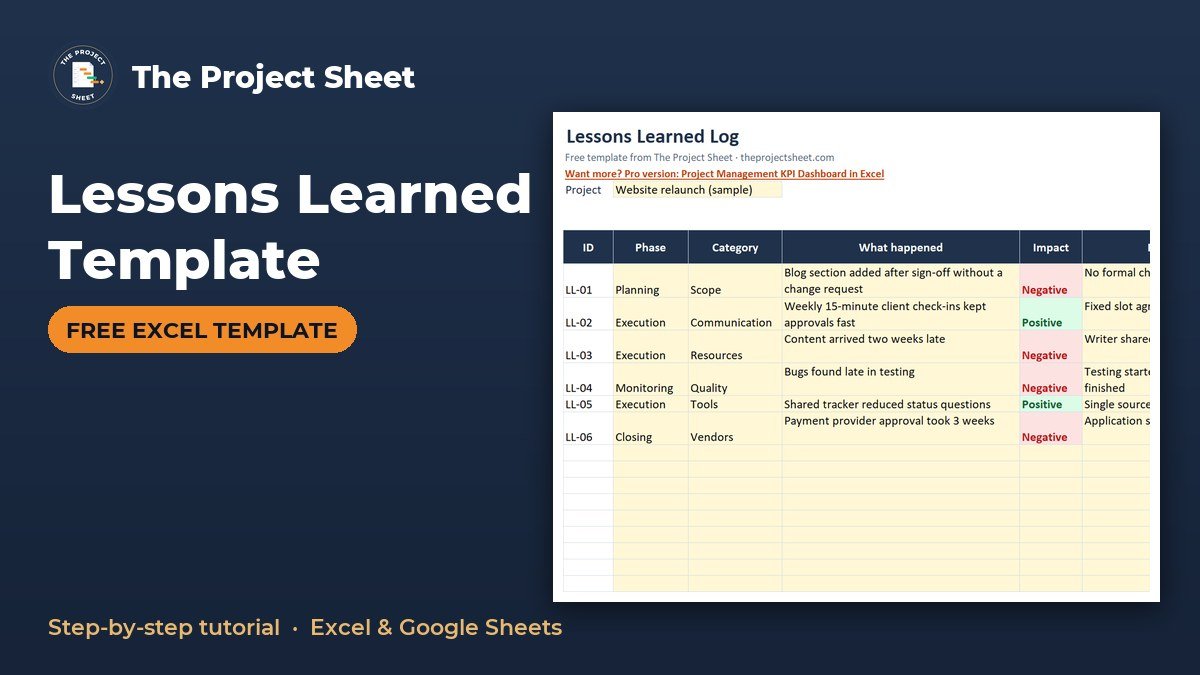
A lessons learned template is a table where you record what happened on a project, the impact, the root cause and the action someone will take next time. To build one in Excel, set up columns for phase, category, what happened, impact, root cause, recommendation, owner and status, then add a small summary that counts lessons by category. The free template is below, ready to use.
Free download
Lessons Learned Log (Excel)
Working formulas, sample data and a How to use sheet. Opens in Excel, or import it into Google Sheets.
What this lessons learned log does and who it is for
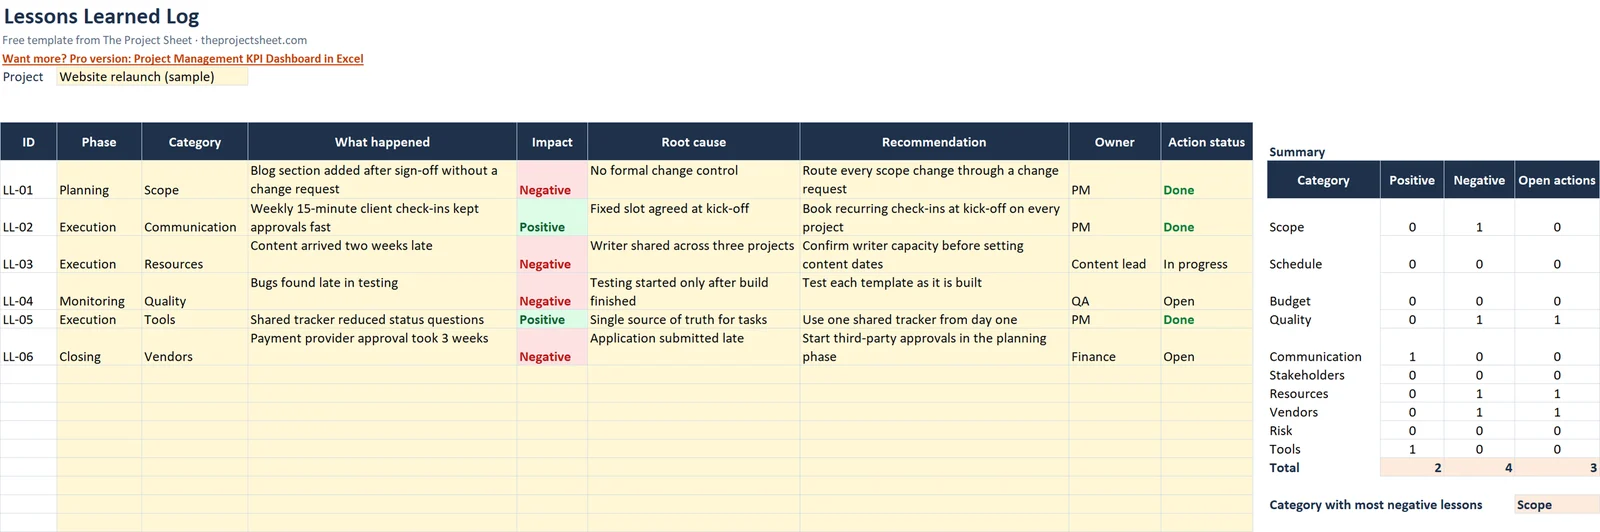
The workbook has two sheets: How to use and Lessons Learned. The log holds up to 40 lessons (rows 8 to 47), and a summary beside it counts positive lessons, negative lessons and open actions for each category.
It suits project managers, team leads, PMP learners and freelancers who want one place to keep lessons instead of a scattered set of meeting notes. It also works as a simple retrospective template in Excel, because each row links an event to a cause and a next step.
A lessons learned log is useful only if people can find and act on the entries later. That is why the sheet pairs every event with a root cause, a recommendation, an owner and a status. A row with all four tells the next team what happened, why it happened and who is responsible for the follow-up.
What each column records
The header row is row 7. Project name goes in cell B4. The table below summarizes the log columns.
| Column | Field | Type |
|---|---|---|
| A | ID | Formula, fills itself |
| B | Phase | Dropdown: Initiation, Planning, Execution, Monitoring, Closing |
| C | Category | Dropdown: Scope, Schedule, Budget, Quality, Communication, Stakeholders, Resources, Vendors, Risk, Tools |
| D | What happened | Free text |
| E | Impact | Positive or Negative, colored green or red |
| F | Root cause | Free text |
| G | Recommendation | Free text |
| H | Owner | Free text |
| I | Action status | Dropdown: Open, In progress, Done |
Phase and category answer two different questions. Phase tells you when in the project the event happened, and category tells you what kind of issue it was. Together they let you spot patterns, such as several scope problems that all start in planning.
Build the lessons learned log step by step
Step 1: Set up the sheet and header row
Name the sheet Lessons Learned. Type the project name in B4. In row 7, enter the nine headers from the table above, from ID in A7 to Action status in I7.
Turn on bold for the header row and freeze the panes below row 7, so the headers stay visible when the log grows. This is optional, but it makes a long log easier to read.
Step 2: Add the auto ID in column A
In A8 enter this formula and fill it down to A47:
=IF(D8="","","LL-"&TEXT(ROW()-7,"00"))
The ID stays blank until you type something in column D. Once you do, row 8 becomes LL-01, row 9 becomes LL-02, and so on. The ROW() part subtracts 7 because the first lesson sits in row 8.
Step 3: Create the dropdowns
Select B8:B47 and use Data Validation with a list: Initiation, Planning, Execution, Monitoring, Closing. Do the same for C8:C47 with the ten categories, for E8:E47 with Positive and Negative, and for I8:I47 with Open, In progress and Done. Dropdowns keep spelling consistent, which the summary formulas depend on.
Step 4: Color the impact column
Select E8:E47 and add two conditional formatting rules. Format cells equal to Positive in green and cells equal to Negative in red. You can then scan the column and see the balance of the project at a glance.
Step 5: Build the category summary
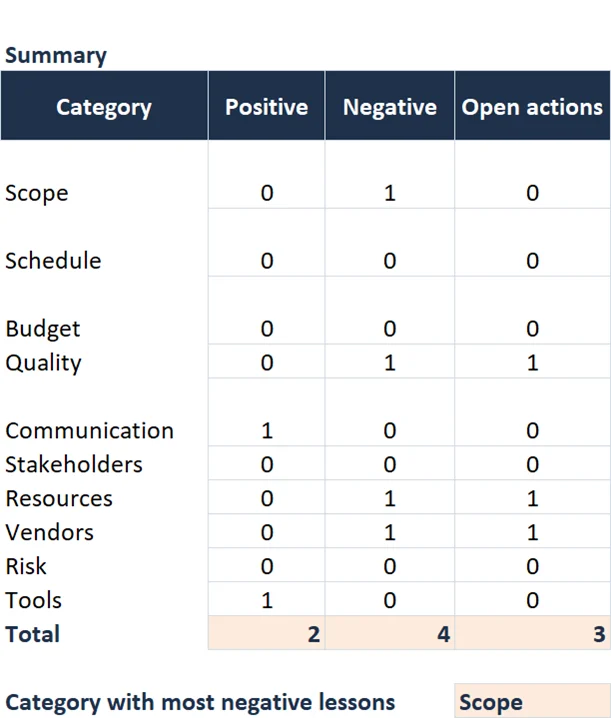
The summary sits in K8:N21. List the ten categories in K9:K18, with headers for Positive, Negative and Open actions across L, M and N. In L9 count positive lessons for the category in K9:
=COUNTIFS($C$8:$C$47,K9,$E$8:$E$47,"Positive")
In M9 use the same formula but with "Negative" as the last criterion. In N9 count actions that are not finished:
=COUNTIFS($C$8:$C$47,K9,$I$8:$I$47,"<>Done",$D$8:$D$47,"<>")
The last criterion skips empty rows, so blank lines are not counted as open actions. Fill all three formulas down to row 18, then add totals underneath.
Step 6: Find the category with the most negative lessons
Add a label such as Category with most negative lessons and use:
=INDEX(K9:K18,MATCH(MAX(M9:M18),M9:M18,0))
MAX finds the highest negative count, MATCH finds its position and INDEX returns the category name. If several categories tie, you get the first one in the list.
Worked example with the sample lessons
The template includes six sample lessons. Three show the pattern well:
- LL-01 (Planning, Scope): “Blog section added after sign-off without a change request.” Impact is Negative, the root cause is “No formal change control” and the recommendation is “Route every scope change through a change request.”
- LL-02 (Execution, Communication): “Weekly 15-minute client check-ins kept approvals fast.” Impact is Positive.
- LL-06 (Closing, Vendors): “Payment provider approval took 3 weeks.” Impact is Negative and the recommendation is “Start third-party approvals in the planning phase.”
Look at LL-01 closely. The event alone (a blog section added late) could be read as a one-off. The root cause, no formal change control, turns it into something the team can fix, and the recommendation says exactly how.
LL-06 works the same way. The problem is a 3-week approval, and the recommendation moves the work earlier, to the planning phase, so the delay does not land at closing.
Across all six samples the summary shows 2 positive lessons, 4 negative lessons and 3 open actions. The category with the most negative lessons shows Scope. Several categories are tied on negative counts, and Scope is the first of them in the list, so read that result as a starting point and not a verdict.
Writing entries that are useful later
Good project lessons learned examples describe a specific event, not a feeling. “Communication was bad” gives the next team nothing to act on. “Approvals stalled because the client contact changed and nobody told us” does.
Use these habits:
- Capture lessons during the project, not only at the end, while details are fresh.
- Include positives. Practices that worked, like the weekly check-ins in LL-02, are worth repeating on purpose.
- Write the recommendation as an instruction, such as “Start third-party approvals in the planning phase”, and not as blame.
- Fill the root cause column. Asking “why” a few times usually moves you from a symptom to something you can change.
- Review the log in the close-out meeting and assign an owner to each open action.
Lessons learned questions to ask the team
If the team is stuck on what to write, these lessons learned questions help produce rows for the log:
- What went better than expected, and why?
- What took longer or cost more than planned?
- Which decision would you change if you started again?
- Where did we wait on someone outside the team?
- What should the next project do in the planning phase to avoid this?
Ask each question separately and give people a few quiet minutes to write before anyone speaks. Then enter the answers in the log as they come, picking a phase and category for each one. Doing it live means the meeting ends with a finished log instead of a to-do list for someone to type up.
How to run a short review session
The log works best when the team reviews it together. A simple flow keeps the session short and focused.
- Filter the Impact column to Negative and read each row aloud, including its root cause.
- Check that every recommendation is written as an instruction and has an owner in column H.
- Filter to Positive and agree which practices the team will repeat.
- Look at the summary in K8:N21 to see which categories carry the most negative lessons and open actions.
- Set the status of each action in column I to Open, In progress or Done.
Keep the first pass to the facts and save the debate about causes for the root cause column. If the team disagrees, write both views in the cell and decide who will investigate.
How to adapt the template
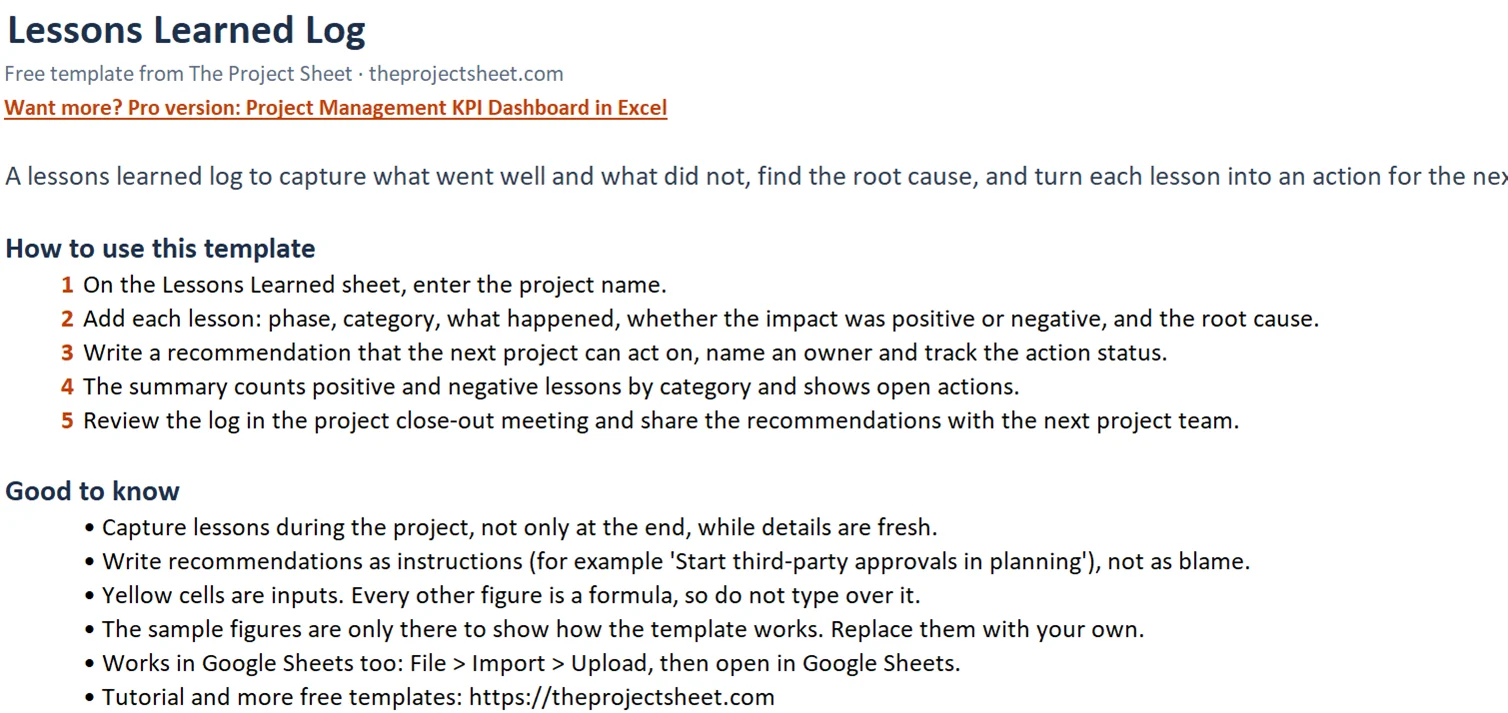
Edit the dropdown lists to match your work. If you run software projects you might swap a category for something more specific, and the summary labels in K9:K18 need to match the new names exactly.
To log more than 40 lessons, insert rows inside the table and copy the formulas down, then extend the ranges in the summary formulas so they still cover every row. You can also filter by owner or phase to prepare for a review meeting.
Lessons often point back to other documents. A scope lesson may lead you to improve your work breakdown structure template, and a schedule lesson to your project timeline template. Pulling a weekly note from a project status report is a quick way to catch lessons as they happen. Sprint teams can pair the log with a burndown chart in Excel and record what the chart revealed.
Common mistakes
- Waiting until the end. Memory fades, and the log ends up with vague entries.
- Only logging problems. A log of failures hides what the team does well.
- Skipping the root cause. Without it, the recommendation tends to repeat the problem in different words.
- No owner on actions. An action with no name beside it stays Open.
- Typing categories by hand. A misspelled category will not be counted by the COUNTIFS formulas. Use the dropdowns.
- Never reopening the log. Check it at the start of the next project.
- Writing blame into the recommendation. Name the process that failed, not the person.
Excel vs Google Sheets
The formulas used here (IF, TEXT, ROW, COUNTIFS, INDEX, MATCH, MAX) work in both Excel and Google Sheets. Dropdowns come from Data Validation in Excel and from Data, then Data validation in Google Sheets.
Conditional formatting is set up in a different menu in each app, but the rules are the same: green for Positive, red for Negative. If you upload the Excel file to Google Sheets, check that the dropdowns and colors came across before you share it.
Google Sheets is handy when several people add lessons at the same time during a retrospective. Excel suits a log that one person maintains and shares as a file. Either way, keep a single master copy so entries do not split across versions.
Next step
Download the file, replace the six samples with lessons from your last project and set an owner on every open action. If you want more templates like this, browse the free templates page or the start here guide. For a ready-made set of project metrics, the Project Management KPI Dashboard in Excel is an option, and more paid sets are listed under pro templates by topic.
Frequently asked questions
What should a lessons learned template include?
It should include the project phase, a category, what happened, the impact, the root cause, a recommendation, an owner and an action status. This template has all of these, with an auto-generated ID for each lesson.
When should you fill in a lessons learned log?
Add entries during the project while details are fresh, then review the whole log in the close-out meeting. Logging only at the end tends to produce vague entries.
Should a lessons learned log include positive lessons?
Yes. Recording what worked, such as short weekly client check-ins, gives the next team practices to repeat. The Impact column in this template marks each lesson as Positive or Negative.
How do I count lessons by category in Excel?
Use COUNTIFS with the category range and the impact range, for example =COUNTIFS($C$8:$C$47,K9,$E$8:$E$47,"Negative"). Fill it down next to your category list.
Can I use this as a retrospective template in Excel?
Yes. Each row links an event to a root cause and a recommendation, which suits sprint or project retrospectives. Use the phase and category dropdowns to group items when you review them.
Free download
Lessons Learned Log (Excel)
Working formulas, sample data and a How to use sheet. Opens in Excel, or import it into Google Sheets.
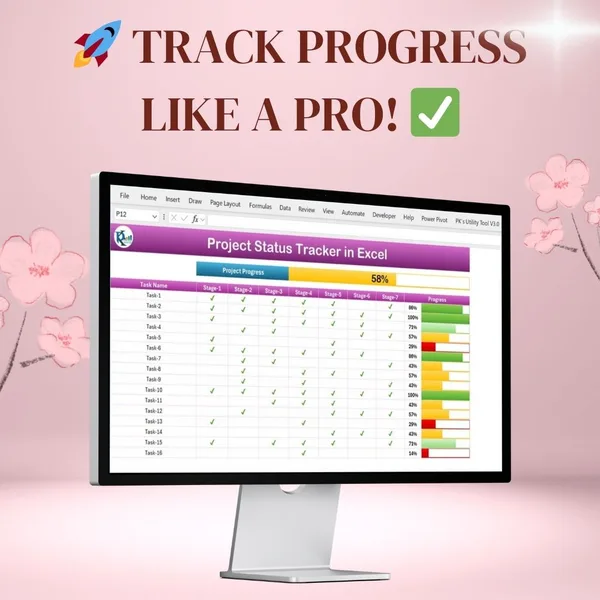
Want the finished version?
Project Progress Tracker in Excel
Colour-coded progress bars and automatic completion percentages.
View the pro template
PK is the founder of PK: An Excel Expert and NextGenTemplates.com and a corporate trainer in Excel, VBA and Power BI. Since 2020 he and his team have built Excel and Google Sheets tutorials and templates for business users, including many project management tools.