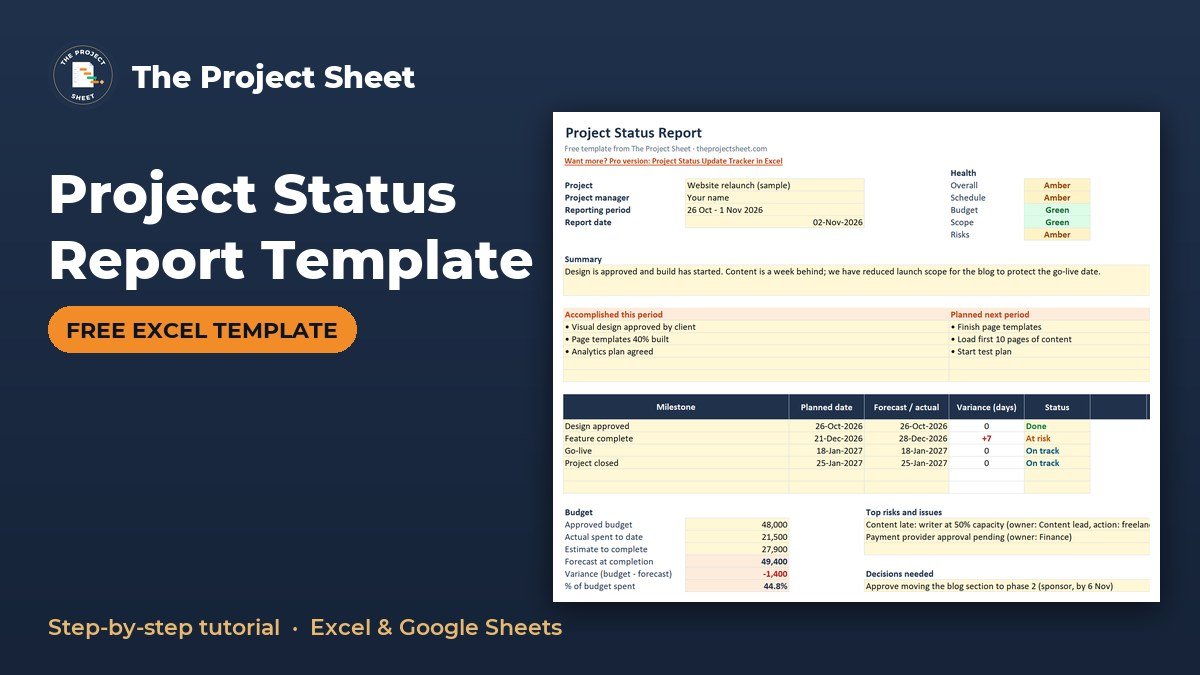
A project status report template is a one-page summary that tells readers where a project stands: overall health, progress, milestones, budget, risks and decisions needed. To write one, fill in a header, set a Red, Amber or Green rating for each area, list what was done and what is next, then add dates and budget figures that calculate their own variances. The free Excel template is below.
Free download
Project Status Report Template (Excel)
Working formulas, sample data and a How to use sheet. Opens in Excel, or import it into Google Sheets.
What this weekly status report template does
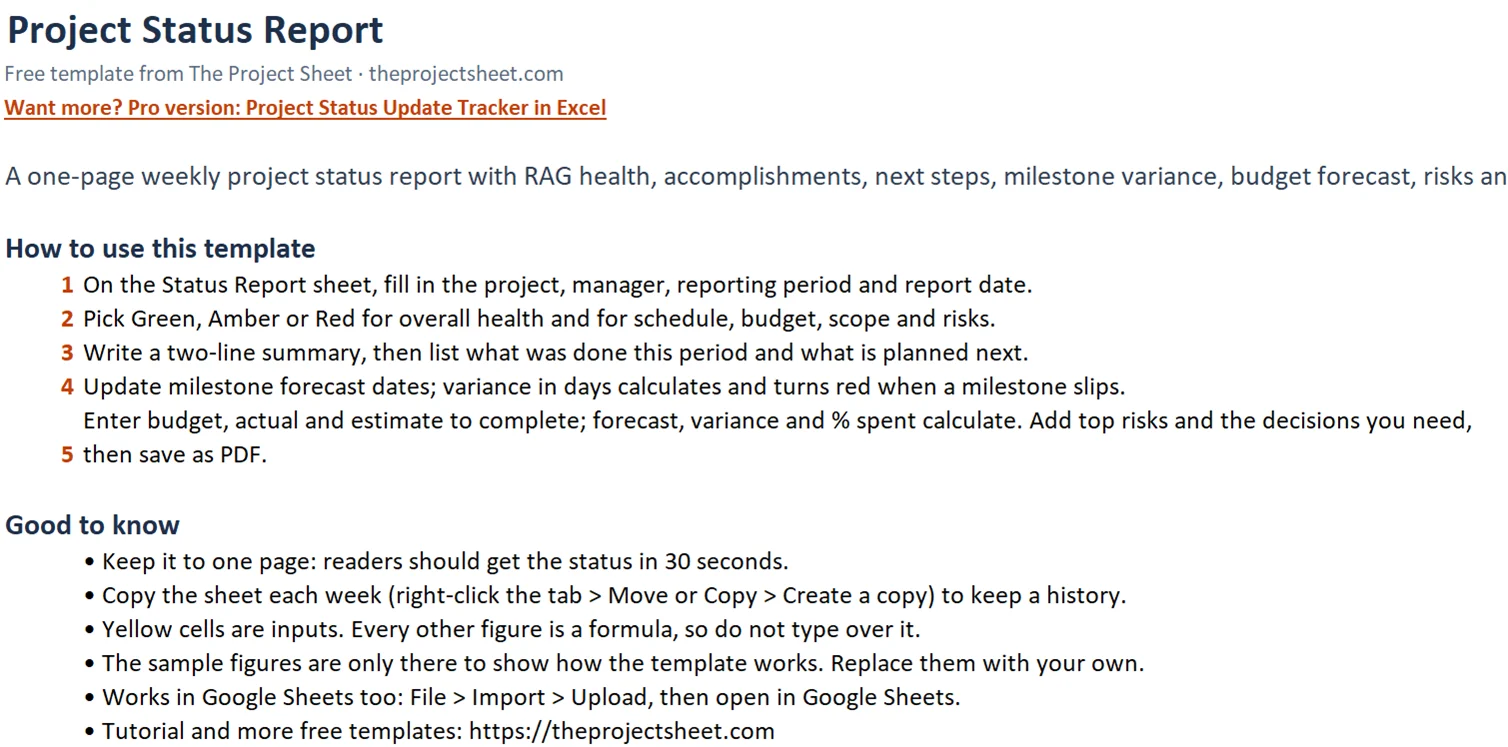
This workbook has two sheets: ‘How to use’ and ‘Status Report’. The report sheet is built to print on one page (print area A1:H36), so your sponsor can read it in about 30 seconds.
It suits project managers, team leads, PMP learners practicing stakeholder reporting, and freelancers who send clients a weekly update. It works as a weekly status report template, but you can change the reporting period to fit a fortnightly or monthly rhythm.
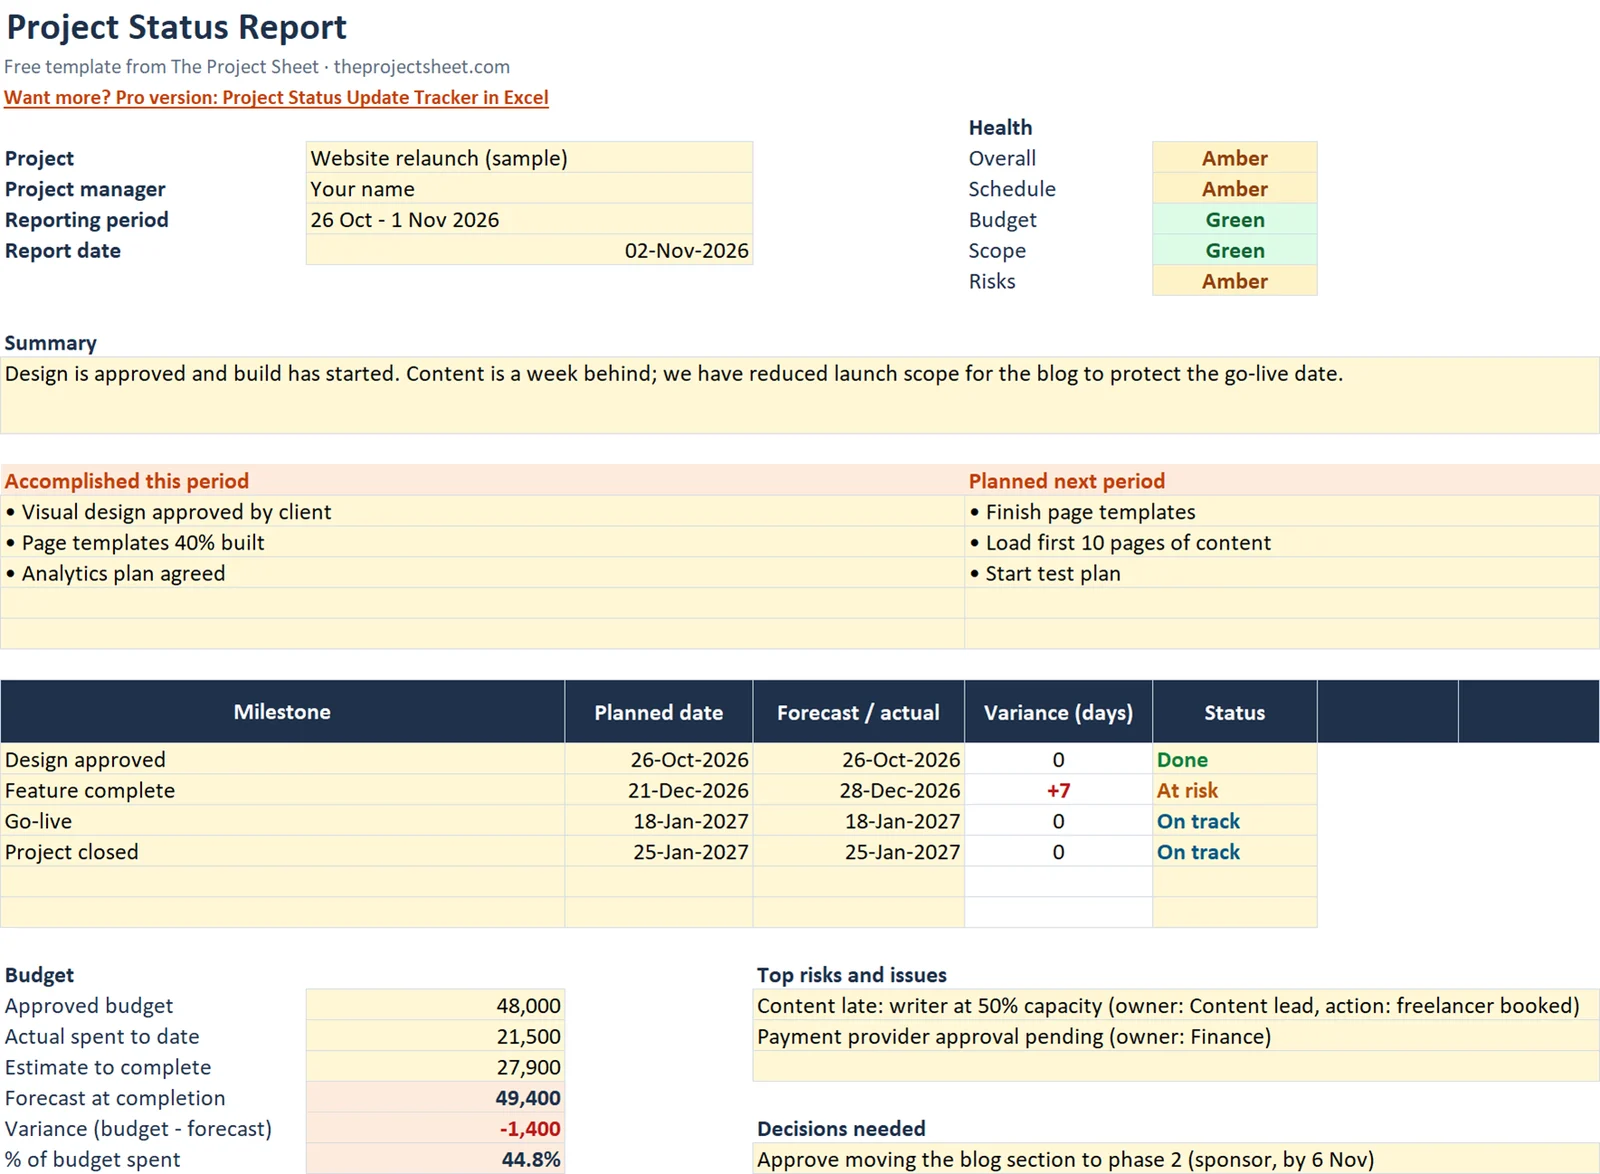
The sheet has six blocks: header info, a RAG status report panel, a summary, accomplishments and plans, a milestone table, and budget with risks and decisions. Each block is described in the steps below.
The design goal is speed of reading. Most sponsors open a status report between meetings, so the rating and the summary sit at the top and the evidence follows underneath. If a reader stops after the first third of the page, they should still know whether to worry.
How to build the project status report step by step
You can fill in the downloaded file straight away, or rebuild it from scratch in a blank workbook to see how each part works. The steps below follow the order I suggest you work in, which is slightly different from the order the reader sees the page.
Step 1: Fill in the header (B5:B8)
Enter four items in B5:B8: the project name, the project manager, the reporting period and the report date. The sample uses a reporting period of 26 Oct – 1 Nov 2026 and a report date of 02-Nov-2026.
Always state the period. A report without one is hard to compare with last week’s, and it is the first thing people check when two versions are floating around in email.
Step 2: Set the health ratings (F5:F9)
Cells F5:F9 hold the RAG ratings (Red, Amber, Green). Each cell has a dropdown with Green, Amber and Red, and a colour rule that fills the cell to match. The five rows are Overall, Schedule, Budget, Scope and Risks.
In the sample, Overall is Amber, Schedule is Amber, Budget is Green, Scope is Green and Risks is Amber. Pick the ratings first, then write the summary to explain them. Splitting health into five rows lets a reader see at a glance which area is causing the Amber, instead of guessing from the overall colour.
Step 3: Write the summary (A12)
Cell A12 holds a two-sentence summary. The first sentence should say how the project is doing. The second should say the single thing the reader needs to know or do.
If you cannot say it in two sentences, the report is probably carrying too much detail. Write the summary last if that helps, but keep it to two sentences either way.
Step 4: List accomplishments and plans (A16:A20 and E16:E20)
Put what was finished this period in A16:A20 and what is planned for the next period in E16:E20. Use short bullets, one outcome per line.
Five lines each is the limit the layout allows, which keeps the page readable. If you have more than five outcomes, keep the ones your reader cares about and leave the rest for the team.
Step 5: Add the milestone table (rows 22-28)
Row 22 is the header, and rows 23-28 hold the milestones. The columns are milestone, planned date, forecast or actual date, variance in days, and status. The variance column uses this formula in row 23, copied down:
=IF(OR(C23="",D23=""),"",D23-C23)
It stays blank until both dates are entered, then subtracts the planned date from the forecast or actual date. A positive result shows as +7 in red because it means the milestone is late. The status column has a dropdown with On track, At risk, Late and Done.
Update the forecast or actual column every week. Once a milestone is finished, replace the forecast with the real date and set the status to Done.
Step 6: Enter the budget (B31:B36)
Type the approved budget in B31, actual spent to date in B32 and estimate to complete in B33. The other three cells calculate:
- Forecast at completion in B34:
=B32+B33 - Variance in B35:
=B31-B34, shown in red when negative (over budget) - % of budget spent in B36:
=B32/B31
Format B36 as a percentage so it reads 44.8% rather than a decimal. The estimate to complete is a judgment, not a calculation, so revisit it each week instead of leaving last week’s figure in place.
Step 7: Add risks, issues and decisions (D31:D33 and D36)
List the top risks and issues in D31:D33. Use D36 for decisions you need from the reader, with an owner and a date if you can.
A status report that asks for nothing is easy to ignore. This cell is where the report earns its place.
Step 8: Check the print preview
Before you send anything, open the print preview and confirm the page ends at column H and row 36 (print area A1:H36). Export to PDF if your readers do not use Excel. Then save the file with the report date in the name so it is easy to find later.
Project status report example with the sample figures
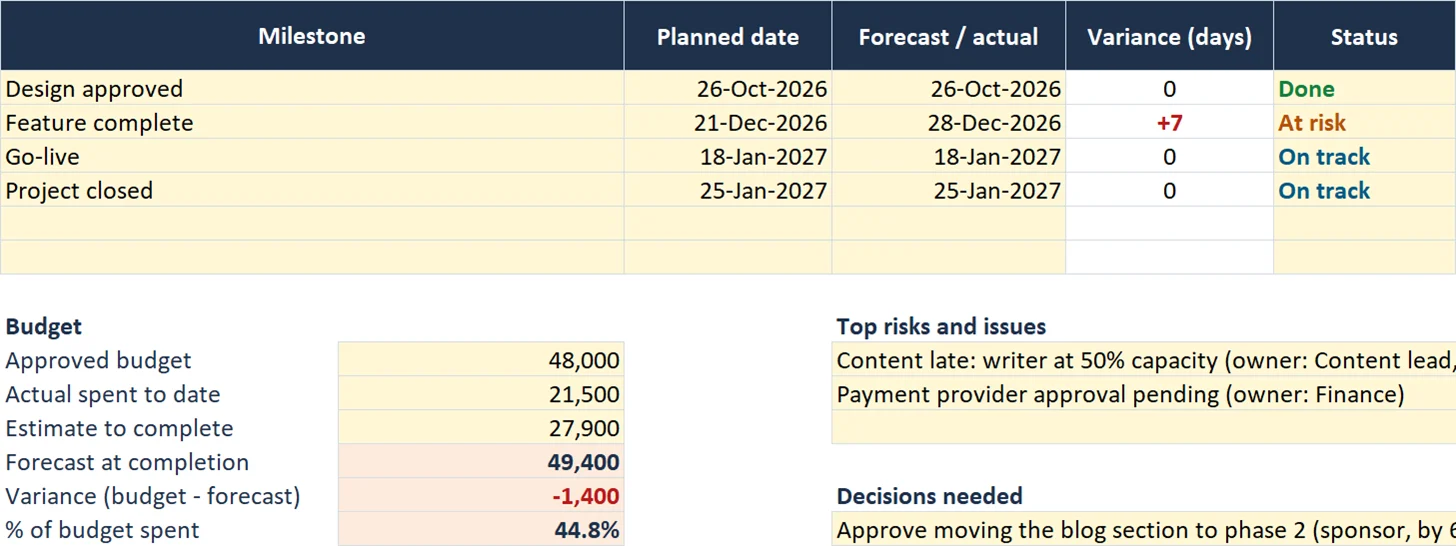
This project status report example shows how the numbers read together. The sample project is Amber overall because of a schedule slip and open risks, while budget is rated Green.
| Milestone | Planned | Forecast / actual | Variance (days) | Status |
|---|---|---|---|---|
| Design approved | 26-Oct-2026 | 26-Oct-2026 | 0 | Done |
| Feature complete | 21-Dec-2026 | 28-Dec-2026 | +7 | At risk |
| Go-live | 18-Jan-2027 | 18-Jan-2027 | 0 | On track |
| Project closed | 25-Jan-2027 |
Feature complete is forecast one week late, so its variance is +7 and shows in red. Go-live still holds its planned date, which is why the status is On track.
Now the budget block. The numbers fit together like this:
| Item | Cell | Value |
|---|---|---|
| Approved budget | B31 | 48,000 |
| Actual spent to date | B32 | 21,500 |
| Estimate to complete | B33 | 27,900 |
| Forecast at completion | B34 | 49,400 |
| Variance | B35 | -1,400 (red, over budget) |
| % of budget spent | B36 | 44.8% |
The approved figure is 48,000 and 21,500 has been spent, which is 44.8% of the budget. Adding the estimate to complete of 27,900 gives a forecast at completion of 49,400. The variance is -1,400, shown in red as over budget.
Notice that the Budget rating in F7 is Green while the forecast is over budget. That is a judgment call you would need to explain or reconsider. The template does not set ratings for you, so check that your ratings agree with your numbers before you send the report.
How the sample report would read to a sponsor
A sponsor opening this page sees an Amber overall rating first. Their eye then drops to the ratings panel, where Schedule and Risks are Amber, and to the milestone table, where one red +7 explains the schedule rating.
The budget block adds a second question: why does a Green budget show a red variance? A good summary in A12 would answer that before the sponsor has to ask. This is the practical value of reading your own report as if you were the recipient.
How to write a project status report that people read
If you are wondering how to write a project status report that gets read, start with the answer. Put the rating and the summary at the top, then give evidence below.
- Write for one reader, usually your sponsor, and use their words.
- Keep bullets to outcomes, not activity. “Design approved” beats “worked on design”.
- Explain every Amber or Red in the summary or the risks block.
- Send it on the same day each week so people know when to look for it.
- Give each decision an owner and a date, so the report leads to action.
- Keep the same layout every week so readers learn where to look.
Choosing a RAG rating
A RAG status report only works when the colours mean the same thing every week. Agree the definitions with your sponsor once. A simple rule many teams use: Green means no help needed, Amber means a problem exists and you have a plan, and Red means you need a decision or support to recover.
Write the definitions on the ‘How to use’ sheet or in your project kickoff notes so that a new reader does not interpret Amber differently from you.
How to adapt the template
Change the reporting period in B7 and the report date in B8 each cycle. Replace the milestone rows with your own dates, and the variance and status update from there.
For a fuller schedule view, pair this report with the Project Timeline Template in Excel, and pull milestone dates from there. If you need to break scope into tasks first, the Work Breakdown Structure Template is a good starting point. For agile teams, a burndown chart in Excel can sit alongside this report as the progress evidence.
To keep a history, copy the sheet each week and rename the tab with the report date. Old reports then stay available when someone asks what you said a month ago.
You can also change the wording of the labels. A freelancer might rename “Project manager” to “Prepared by”, and a team lead might swap the budget block for hours if money is not tracked. Keep the layout inside A1:H36 so the one-page print still works.
Common mistakes
- Rating everything Green to avoid questions. Readers lose trust the first time a Green turns Red.
- Leaving ratings out of line with the numbers, such as Green budget with a negative variance.
- Filling only one of the two dates in a milestone row. The variance formula stays blank until both are entered.
- Overwriting last week’s sheet instead of copying it, which removes your history.
- Listing risks with no owner or action, and asking for no decisions.
- Spilling past column H, which breaks the one-page print layout.
- Forgetting to update the estimate to complete, so the forecast at completion goes stale.
- Changing the meaning of Amber from one week to the next.
Excel vs Google Sheets notes
| Feature | Excel | Google Sheets |
|---|---|---|
| Formulas (IF, OR, subtraction, division) | Work as written | Work as written |
| RAG dropdowns | Data validation lists | Dropdown via Data validation |
| Colour rules | Conditional formatting | Conditional formatting, re-check after upload |
| One-page print | Print area A1:H36 | Set the print range and fit to width in print settings |
If you upload the file to Google Sheets, open each dropdown and colour rule to confirm it came across. Then check the print preview before you share a PDF.
Next step
Download the file, replace the sample project with yours and fill in this week’s ratings first. Then send it on the same day each week. If you want a lessons log for the end of the project, try the Lessons Learned Template. You can also browse the free templates page, or the start here guide if you are new to the site.
Readers who want to track updates across several projects can look at the Project Status Update Tracker in Excel, or see more options in the pro templates by topic.
Frequently asked questions
What should a project status report include?
It should include the overall health, a short summary, what was done and what is planned next, milestone dates, budget figures, top risks and issues, and any decisions you need. This template covers all of those on one printable page.
What does RAG status mean in a project report?
RAG stands for Red, Amber, Green. Green means on track, Amber means there is a problem that needs attention, and Red means the project is off track and needs action or a decision. In this template each health area has a dropdown that colours the cell.
How often should I send a project status report?
Weekly is the most common rhythm, and the template is set up for a one-week reporting period. You can change the dates in the header for a fortnightly or monthly report.
How is the milestone variance calculated in this template?
The variance is the forecast or actual date minus the planned date, using =IF(OR(C23="",D23=""),"",D23-C23). A positive number such as +7 means the milestone is late and shows in red.
Can I use this project status report template in Google Sheets?
Yes. The formulas work in Google Sheets, but check that the dropdowns and colour rules came across after you upload the file. Also set the print range and check the preview to keep it on one page.
Free download
Project Status Report Template (Excel)
Working formulas, sample data and a How to use sheet. Opens in Excel, or import it into Google Sheets.
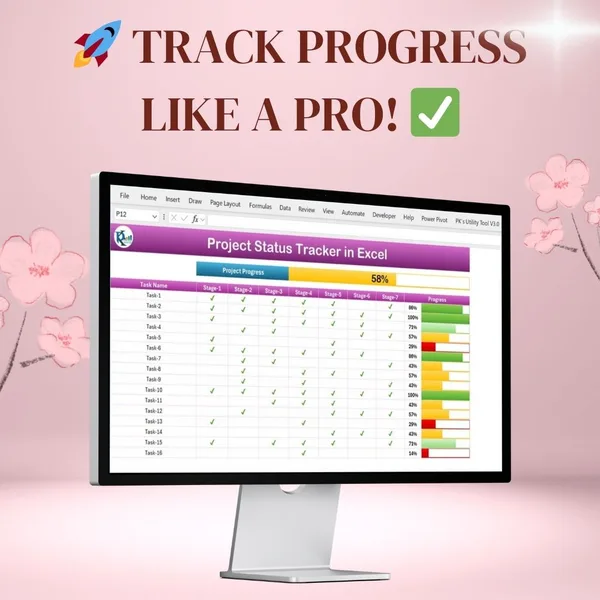
Want the finished version?
Project Progress Tracker in Excel
Colour-coded progress bars and automatic completion percentages.
View the pro template
PK is the founder of PK: An Excel Expert and NextGenTemplates.com and a corporate trainer in Excel, VBA and Power BI. Since 2020 he and his team have built Excel and Google Sheets tutorials and templates for business users, including many project management tools.