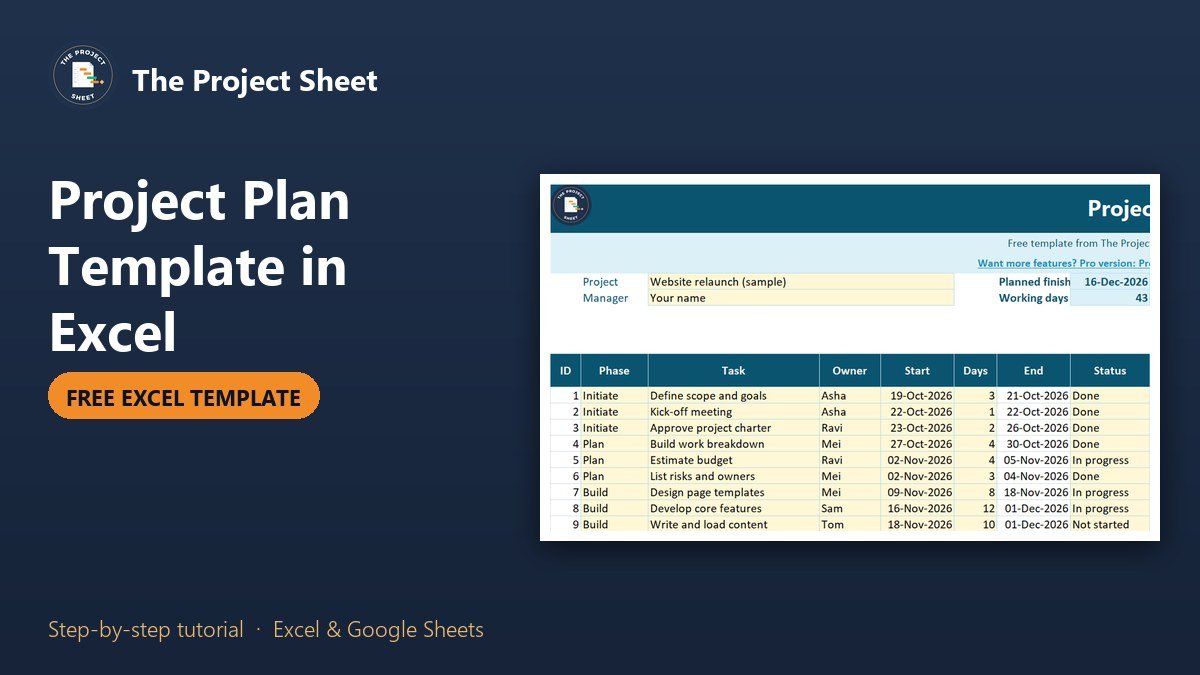
A project plan template in Excel is a table that lists every task with its phase, owner, start date and number of working days, then calculates the end dates for you. To build one, add those columns, use WORKDAY to work out each end date, and add a status and percent done so you can see progress. The free template below already has all of it, with a phase summary and a flag that shows late tasks.
Free download
Project Plan Template practice file (.xlsx)
Working formulas, sample data and a How to use sheet. Opens in Excel, or import it into Google Sheets.
What this project plan template does
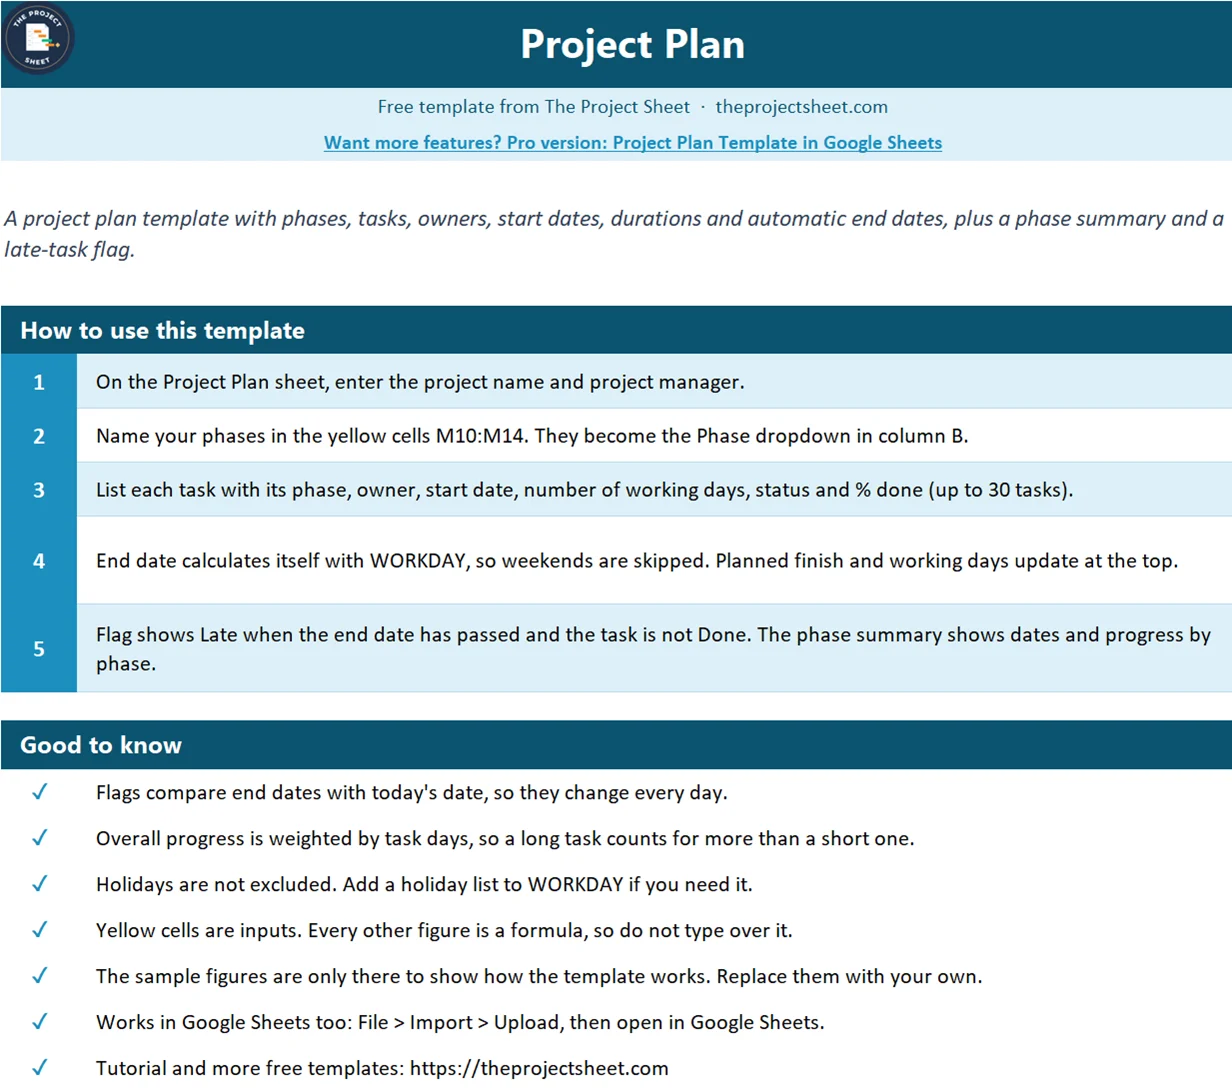
This is a one-sheet plan for a small or medium project. You list up to 30 tasks, give each one a phase, an owner, a start date and a duration, and the sheet fills in the end date, the planned finish date, the working days in the plan and the overall progress.
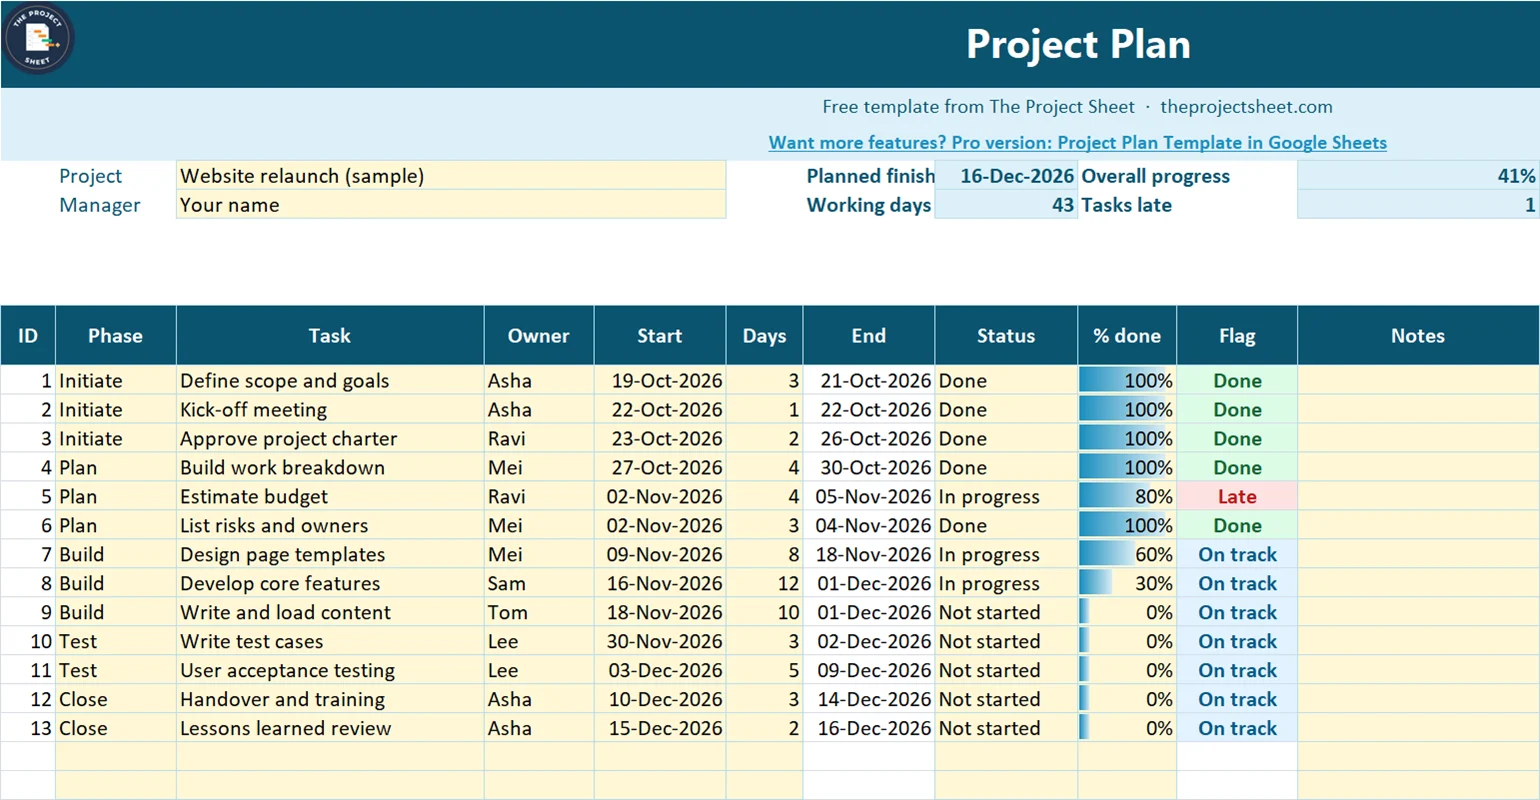
The sample plan is a website relaunch with 13 tasks in five phases: Initiate, Plan, Build, Test and Close. It starts on 19-Oct-2026, finishes on 16-Dec-2026, covers 43 working days and shows 41% overall progress. One task, Estimate budget, is flagged Late because its end date of 05-Nov-2026 has passed and it is only 80% done.
Yellow cells are inputs. Everything else is a formula, so you fill in the yellow cells and leave the rest alone. The template has no gridlines, so it prints cleanly on one page.
Who it is for
This template suits project managers, team leads, freelancers and small-business owners who need a clear plan without installing project software. If you want bars on a timeline, see the Gantt chart tutorial. If you want a tracker with a dashboard on top, the project management template covers that.
The columns, one by one
| Column | What goes there | Input or formula |
|---|---|---|
| A: ID | Task number | Formula |
| B: Phase | Dropdown from your five phase names | Input |
| C: Task | What has to be done | Input |
| D: Owner | Who is responsible | Input |
| E: Start | First working day of the task | Input |
| F: Days | Working days it takes | Input |
| G: End | Last working day | Formula |
| H: Status | Not started, In progress, Blocked or Done | Input |
| I: % done | Progress, with a data bar | Input |
| J: Flag | Done, Late, Blocked or On track | Formula |
| K: Notes | Anything else | Input |
How to build the project plan template in Excel
Use the free file as it is, or follow these steps to build your own. Cell addresses match the template.
Step 1: Set up the header
Put the project name in C4 and the project manager in C5. Row 9 holds the column headings, and the tasks run from row 10 to row 39.
Step 2: Name your phases
Type five phase names in M10:M14. Then select B10:B39 and add a data validation list with the source:
=$M$10:$M$14
Each task now picks its phase from a dropdown, and renaming a phase in column M changes the list.
Step 3: Add owners, dates and durations
Enter the owner, the start date and the number of working days for each task. A start date should be a real date, so type it as 19-Oct-2026 or similar, not as text.
Step 4: Calculate the end date
The end date skips weekends. A task that starts Monday and takes 3 days ends on Wednesday, so the formula counts the start day as day one. In G10:
=IF(OR(E10="",F10=""),"",WORKDAY(E10,F10-1))
Fill it down to row 39. Rows with no start date or no duration stay blank.
Step 5: Add a status list and a progress bar
Give H10:H39 a data validation list with the source Not started,In progress,Blocked,Done. Format I10:I39 as a percentage, and add a data bar from Home > Conditional Formatting > Data Bars, with a minimum of 0 and a maximum of 1.
Step 6: Add the late flag
The flag reads the status and compares the end date with today. In J10:
=IF(C10="","",IF(H10="Done","Done",IF(G10<TODAY(),"Late",IF(H10="Blocked","Blocked","On track"))))
Add conditional formatting for the words Late, Blocked, Done and On track so each gets its own colour.
Step 7: Add the summary at the top
The planned finish date is the latest end date in the plan. In H4:
=MAX(G10:G39)
The working days in the plan run from the earliest start to that finish date. In H5:
=NETWORKDAYS(MIN(E10:E39),H4)
Late tasks are a simple count in K5:
=COUNTIF(J10:J39,"Late")
Step 8: Weight the overall progress
A plain average treats a one-day task like a twelve-day task. A weighted average counts each task by its days. In K4:
=IFERROR(SUMPRODUCT(F10:F39,I10:I39)/SUM(F10:F39),0)
On the sample plan the tasks add up to 60 days, of which 24.6 are complete, so the result is 41%.
Step 9: Build the phase summary
For each phase name in M10:M14, count its tasks in N10, then find its first start and last end:
=COUNTIF($B$10:$B$39,M10)
In O10 use =MINIFS($E$10:$E$39,$B$10:$B$39,M10) and in P10 use =MAXIFS($G$10:$G$39,$B$10:$B$39,M10). For the percent done in Q10, weight by days again:
=SUMPRODUCT(($B$10:$B$39=M10)*$F$10:$F$39*$I$10:$I$39)/SUMIFS($F$10:$F$39,$B$10:$B$39,M10)
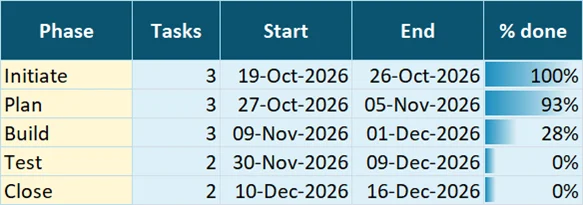
On the sample plan, Initiate is 100% done, Plan is 93%, Build is 28% and Test and Close have not started.
How to use the plan week to week
- Update Status and % done in your weekly meeting, task by task.
- Look at the Flag column first. Each Late task needs a new date, more help or a decision.
- If a task slips, change its days or its start date. The end date, the planned finish and the phase summary move with it.
- Check the planned finish in
H4against the date you promised. If it has moved, tell your stakeholders before they ask. - Filter column D by owner to prepare one-to-one conversations, or by phase to report on one stage.
Common mistakes
- Typing dates as text. If a start date is left-aligned and the end date stays blank, Excel has read it as text. Retype it as a date.
- Counting calendar days. The Days column means working days. A 5-day task that starts on a Wednesday ends the next Tuesday, not on Sunday.
- Skipping holidays.
WORKDAYonly skips weekends unless you give it a holiday list. Add one as a third argument if your project crosses public holidays. - Making tasks too big. A task that takes 30 days hides problems. Split anything over about 10 days into smaller steps.
- Leaving percent done unchanged. A plan with stale progress looks calm until the deadline arrives. Update it every week.
- Forgetting that Flag changes daily. It compares end dates with today, so a plan that was on track last week can show Late today.
Excel and Google Sheets notes
The formulas used here work in both programs: WORKDAY, NETWORKDAYS, MINIFS, MAXIFS, SUMPRODUCT and COUNTIF. MINIFS and MAXIFS need Excel 2019 or Microsoft 365. To use the file in Google Sheets, upload it to Google Drive and open it with Google Sheets, or use File > Import. More free files are on the free templates page.
Next step
Replace the sample tasks with your own, set the start date of the first task and give every task an owner. Then check the planned finish date against your deadline.
Want more?
Project Plan Template in Google Sheets
Need the plan in Google Sheets, with more views for a team? The full version is built for sharing and live updates.
Frequently asked questions
How do I make a project plan in Excel?
List your tasks in a table with phase, owner, start date and working days, then calculate the end date with WORKDAY. Add status, percent done and a flag for late tasks. The free template on this page has all of those columns built and filled with a sample plan.
What formula calculates the end date of a task?
Use WORKDAY with the start date and the days minus one. In this template, G10 is =IF(OR(E10="",F10=""),"",WORKDAY(E10,F10-1)), so a 3-day task starting on Monday ends on Wednesday.
How does the template show a late task?
The Flag column compares the end date with today's date. If the end date has passed and the status is not Done, the flag reads Late and turns red. Tasks marked Done show Done, and blocked tasks show Blocked.
How is overall progress calculated?
It is weighted by task days, using =SUMPRODUCT(F10:F39,I10:I39)/SUM(F10:F39). A 12-day task at 30% counts for more than a 1-day task at 100%. On the sample plan the result is 41%.
Does the project plan template work in Google Sheets?
Yes. Upload the file to Google Drive and open it with Google Sheets, or use File > Import. WORKDAY, NETWORKDAYS, MINIFS, MAXIFS and SUMPRODUCT all work there.
Free download
Project Plan Template practice file (.xlsx)
Working formulas, sample data and a How to use sheet. Opens in Excel, or import it into Google Sheets.
Want the finished version?
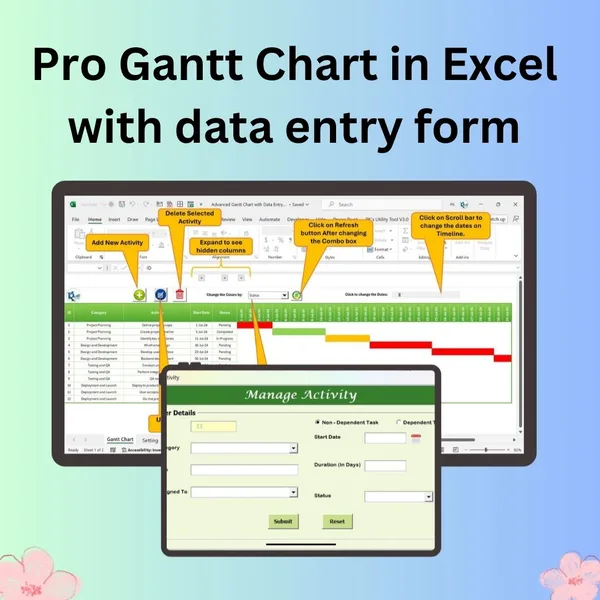
Pro Gantt Chart in Excel with Data Entry Form
Add and update activities through a form while the Gantt chart updates itself.
View the pro template
PK is the founder of PK: An Excel Expert and NextGenTemplates.com and a corporate trainer in Excel, VBA and Power BI. Since 2020 he and his team have built Excel and Google Sheets tutorials and templates for business users, including many project management tools.